Notes
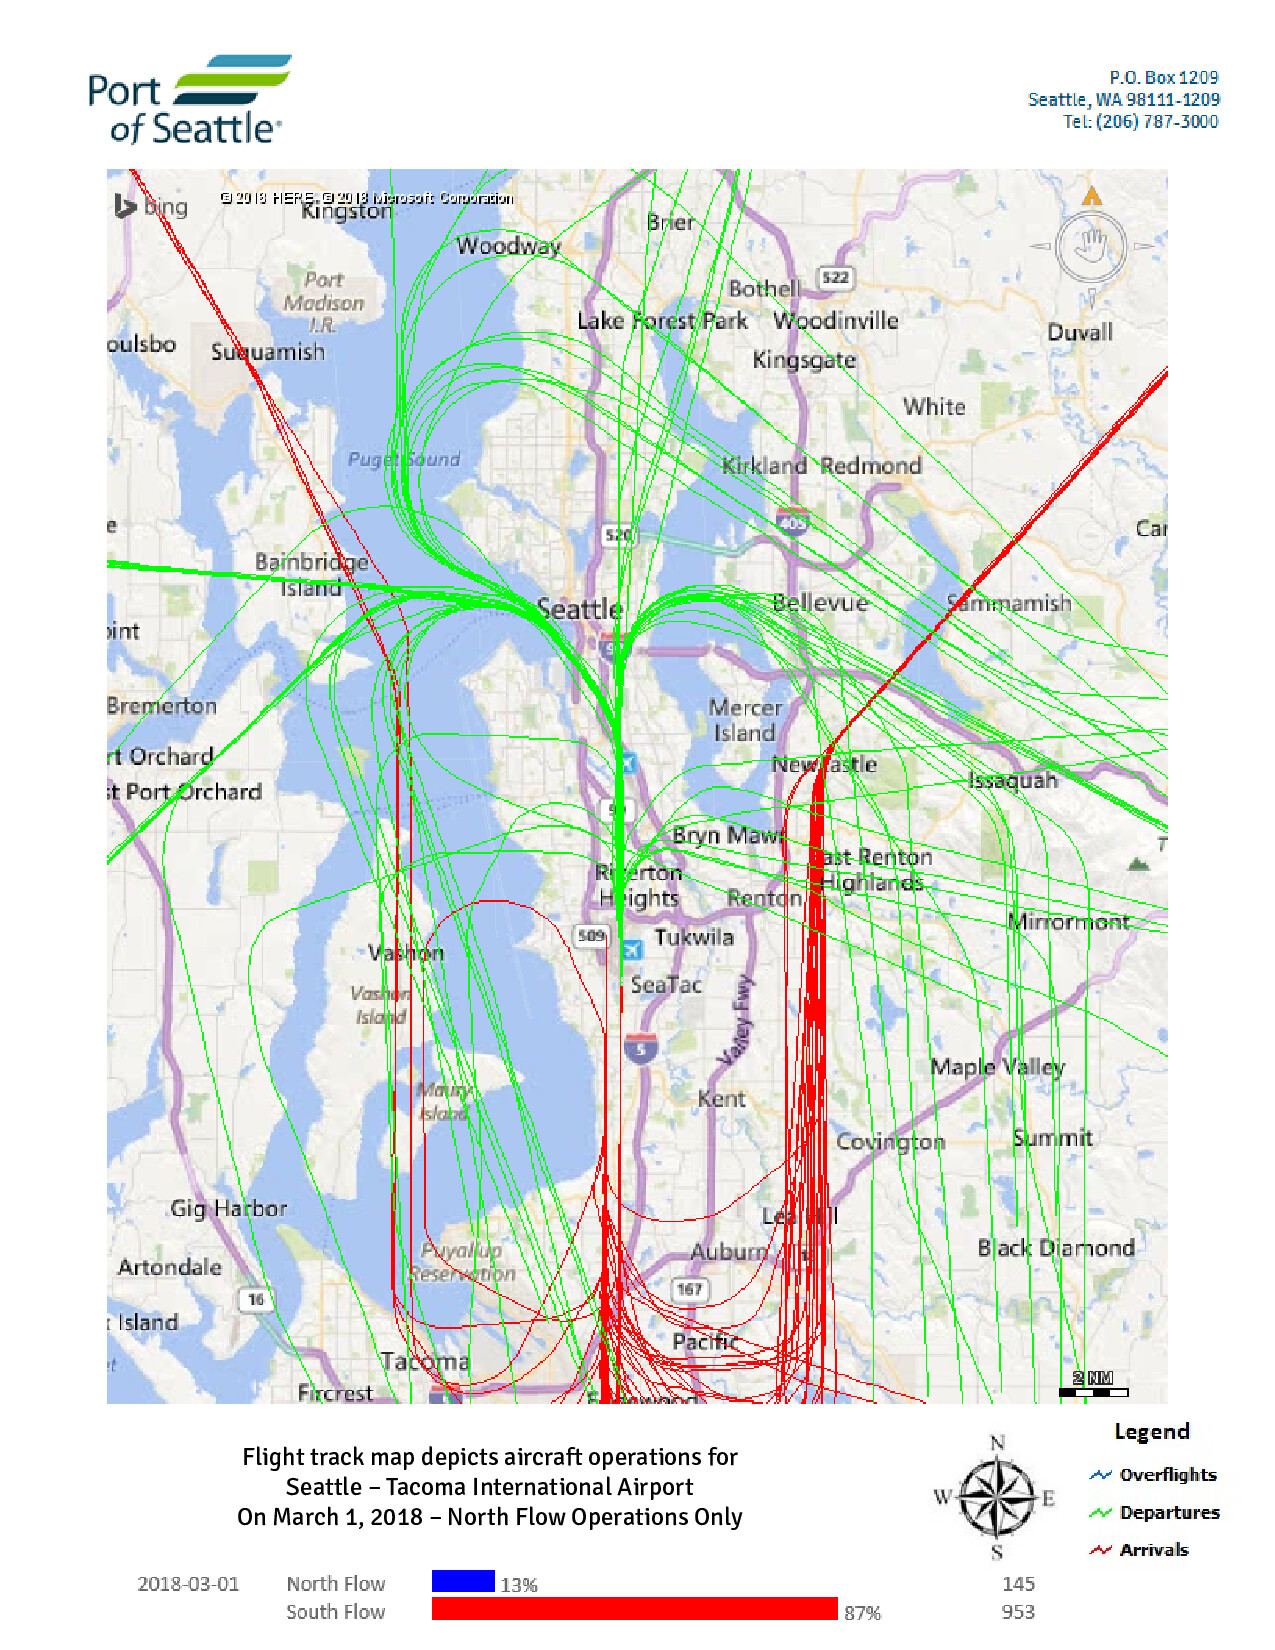
Cumulative flight tracks both north flow and south flow
I understand that you will never share my information with anyone, you will only use it to keep me updated on relevant events and that I may unsubscribe at any time.
Cumulative flight tracks both north flow and south flow