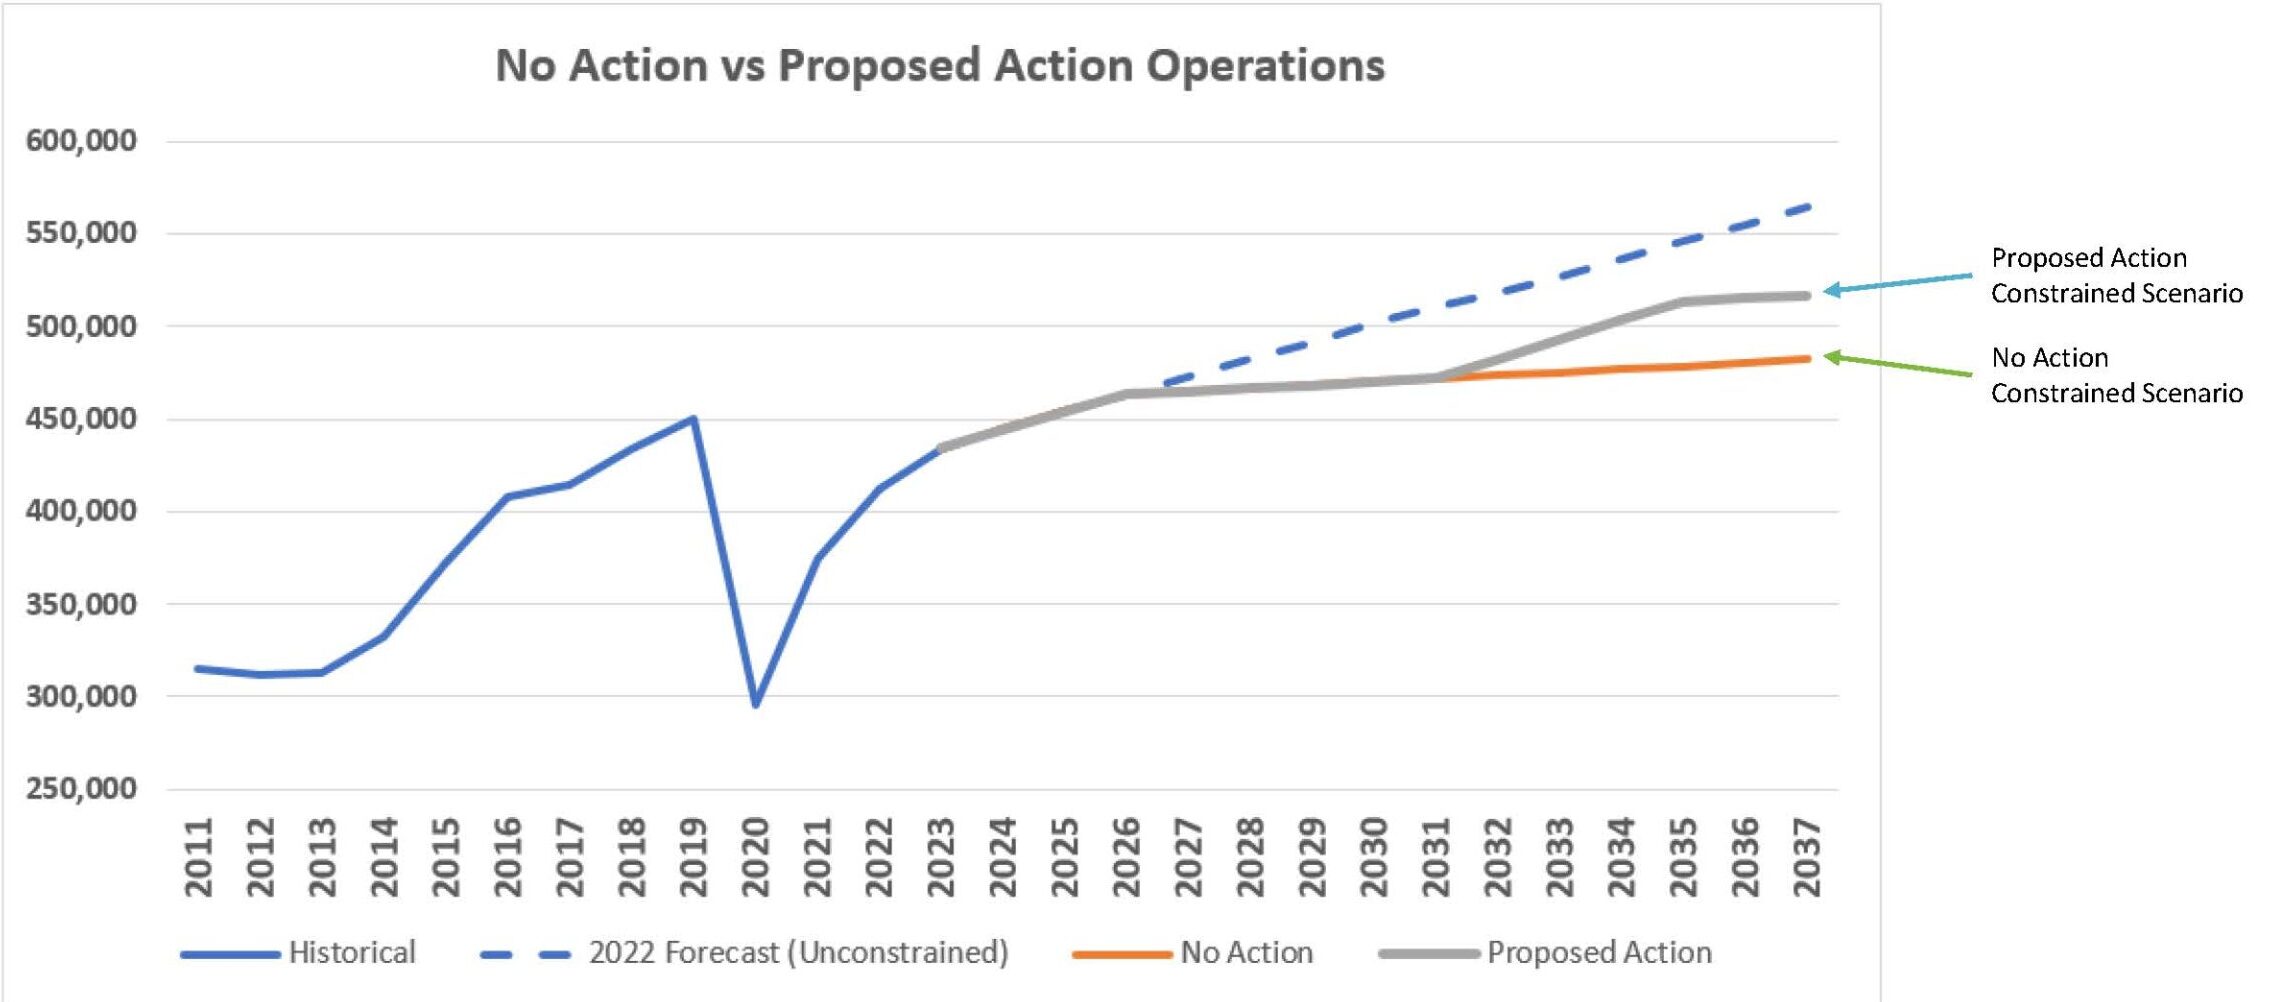
A line graph comparing historical aircraft operations data (2011–2022) with forecast scenarios through 2037, including an unconstrained 2022 forecast, a No Action constrained scenario, and a Proposed Action constrained scenario. The chart shows operations declining sharply in 2020 (likely due to COVID-19) and recovering, with the Proposed Action scenario reaching approximately 520,000 operations and the No Action scenario capping near 485,000 operations by 2037.Open full document
Notes
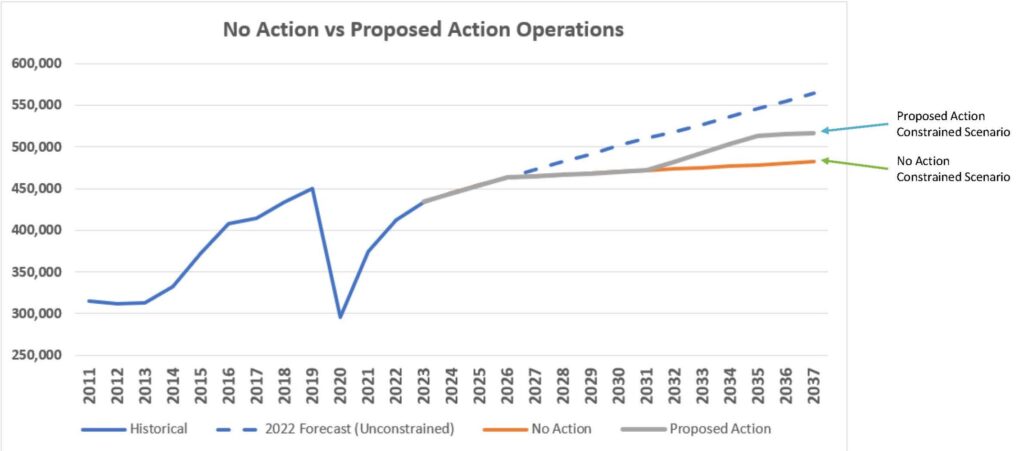
A line graph comparing historical aircraft operations data (2011–2022) with forecast scenarios through 2037, including an unconstrained 2022 forecast, a No Action constrained scenario, and a Proposed Action constrained scenario. The chart shows operations declining sharply in 2020 (likely due to COVID-19) and recovering, with the Proposed Action scenario reaching approximately 520,000 operations and the No Action scenario capping near 485,000 operations by 2037.