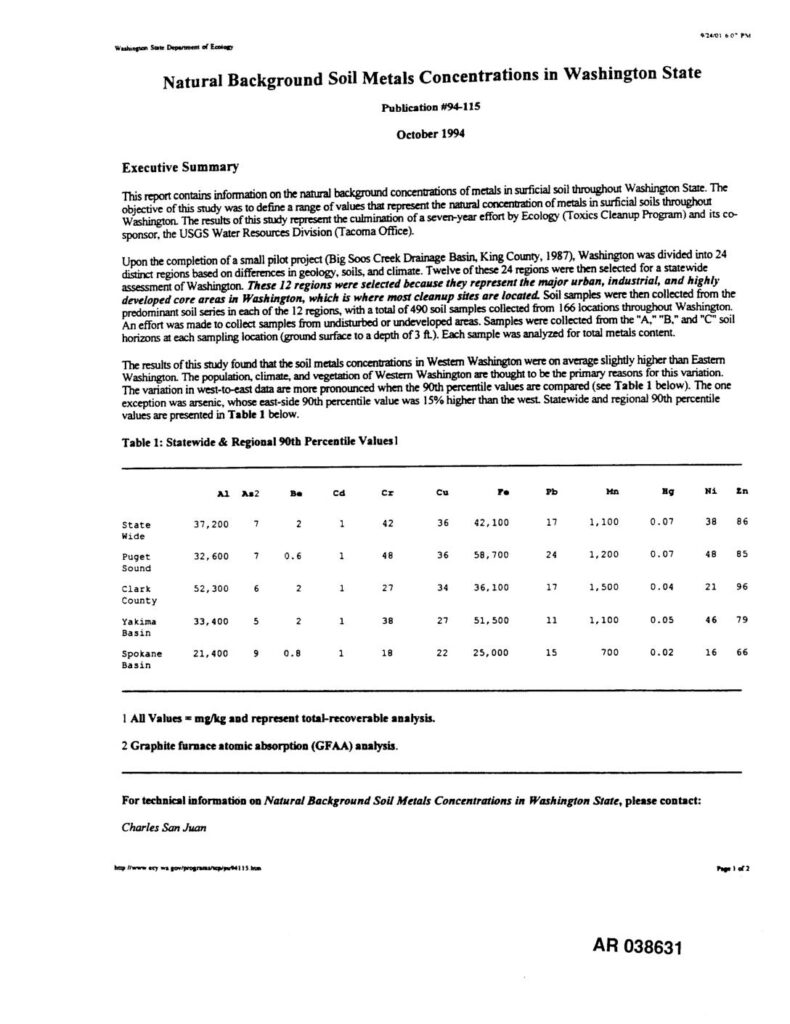
EXH1063038631

PCHBPollution Control Hearings Board of the State of Washington

Natural Background Soil Metals Concentrations in Washington State Publication tK)4-115 October 1994 Executive Summary Thisreportcontainsinformationonthenaturalbackgroundconcenlrationsof metals insurficialsoilu'm_ghoutWashingtonState.The objectiveof thisstudy was todefinea rangeof valuesthatrepresentthe nature]concentrationof metals insurficia]soils throughout Washington.Theresultsof this studyrtTxesemthe culminationof a seven-yeareffortby Ecology CToxicsCleanupProgram)and itsco- sponsor,theUSGS WaterResounu_ Division CI'acomaOffice). Uponthecompletionof a sinai| #lot project(Big Soos CreekDrainageBasin,King County, 1987),Washington was divided into24 distinct regions based on differences in geology, soils, and climate. Twelve of these 24 regions were then selected for a statewide assessment of WashingIon. These 12 regions were selected because they represent the major urban, industrial, and highly developed core areas in Washington, which is where most cleanup sites are located Soil samples were then collected from the predominant soil series in each of the 12 regions, with a total of 490 soil samples collected fi'om 166 locations throughout Washington. An effortwas madeto collect samplesfromundisturbedorundevelopedareas.Sampleswerecollected fromthe "A,""B,"and"C"soil horizons at each sampling location (ground surface to a depth of 3 ft.). Each sample was analyzed for total metals content. Theresultsof thisstudyfoundthatthesoilmetalsconcentrationsin WesternWashingtonwereon averageslightlyhigherthanEastern Washington.The population,climate,andvegetationof WesternWashingtonarethoughtto bethe primaryreasonsforthis variation. Thevariationin west-to-eastdataaremorepronouncedwhen the 90th percentilevaluesarecompared(see Table I below). The one exception was arsenic, whose east-side 90th percentile value was 15%higher than the west. Statewide and regional 90th percentile values are presented in Table I below. Table 1: Statewide & Regional 90th Percentile Valuesl 1_2 Be Cd Cz Cu Fe Pb Mn Hg N£ Zn State 37,200 7 2 1 42 36 42,100 17 i,I00 0.07 38 86 Wide Puget 32,600 7 0.6 1 48 36 58,700 24 1,200 0.07 48…
V V