TagPM25(5)
-
2022-09-09 23:35
Washington Air Monitoring Network: Air Quality Program
Washington State Department of Ecology -
2020-12-17 13:46
Who Gets to Breathe Clean Air in New Delhi?
A visual story of pollution in New Delhi. A great explainer on PM25. -
 2020-07-28 13:08
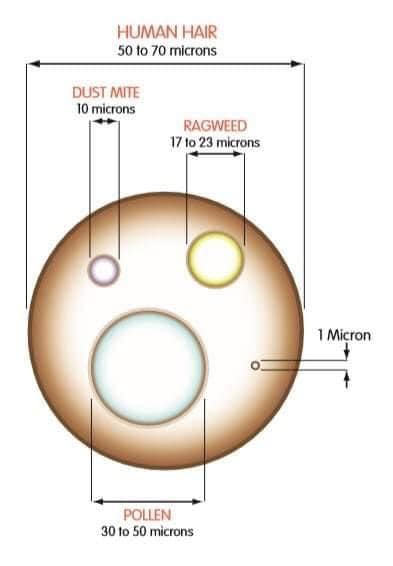
Relative sizes of various allergens
Diagram showing the relative sizes of a human hair, dust mite, ragweed, pollen in microns. PM25 refers to 2.5 microns. -
 2019-04-17 20:35
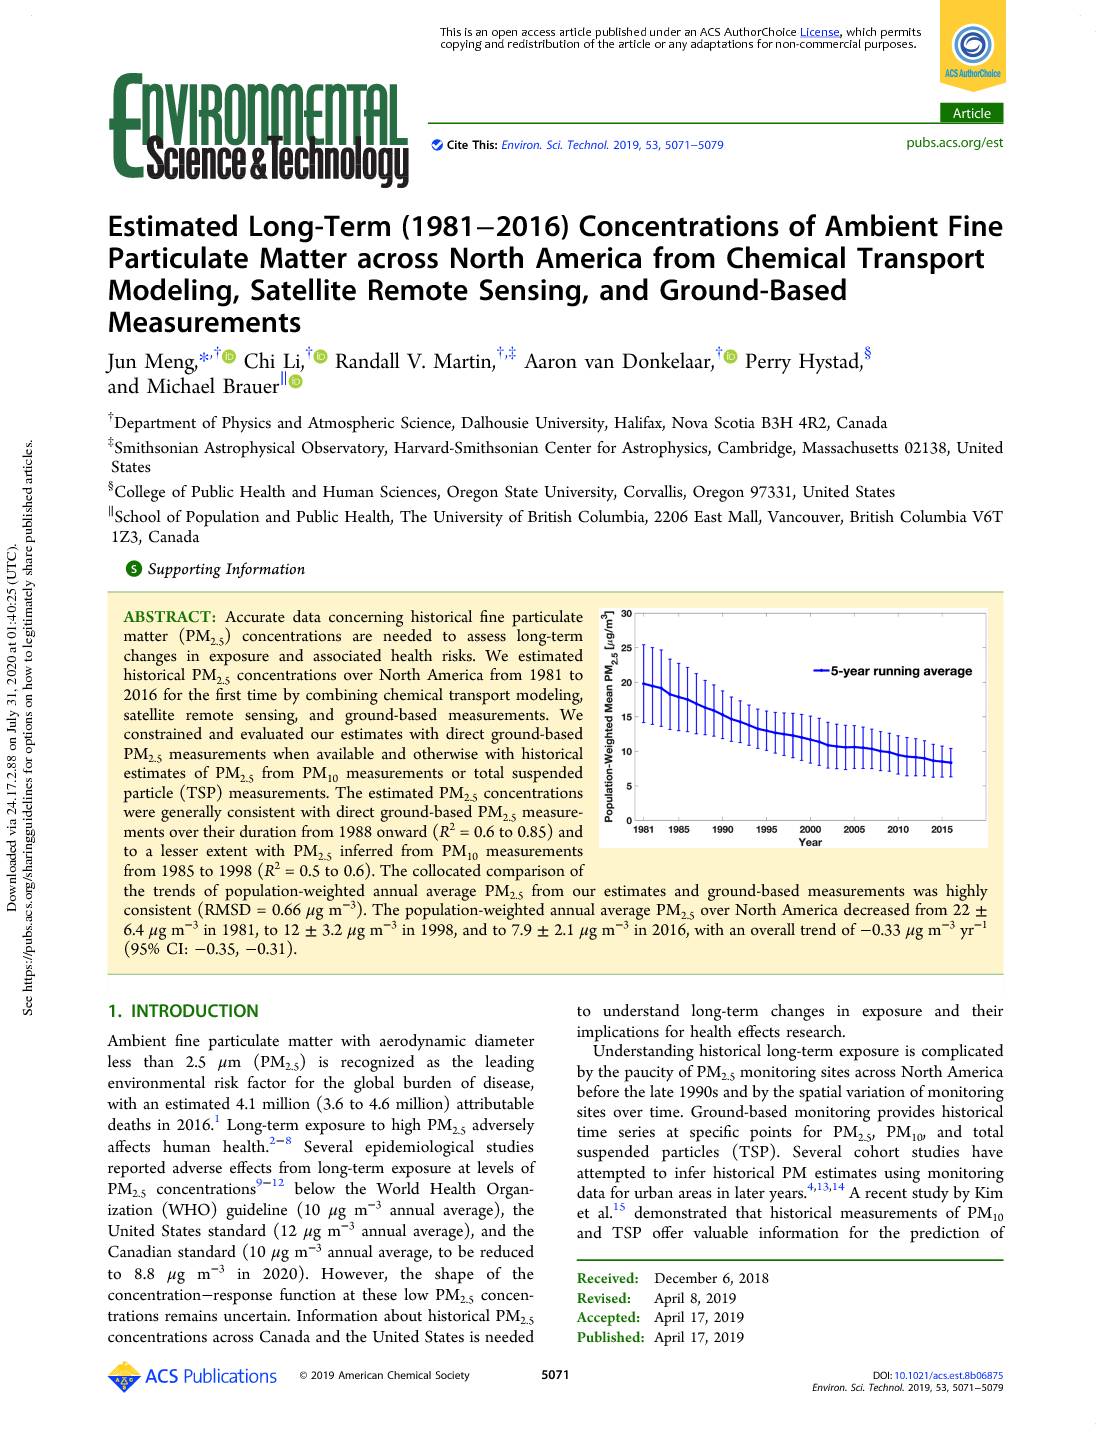
Estimated Long-Term (1981−2016) Concentrations of Ambient Fine Particulate Matter across North America from Chemical Transport Modeling, Satellite Remote Sensing, and Ground-Based Measurements
Estimated Long-Term (1981−2016) Concentrations of Ambient Fine Particulate Matter across North America from Chemical Transport Modeling, Satellite Remote Sensing, and Ground-Based Measurements Jun Meng,*,† Chi Li,† Randall V. Martin,†,‡ Aaron van Donkelaar,† Perry Hystad,§ and Michael Brauer∥ †Department of Physics and Atmospheric Science, Dalhousie University, Halifax, Nova Scotia B3H 4R2, Canada ‡Smithsonian Astrophysical Observatory, Harvard-Smithsonian Center for Astrophysics, Cambridge, Massachusetts 02138, United States §College of Public Health and Human Sciences, Oregon State University, Corvallis, Oregon 97331, United States ∥School of Population and Public Health, The University of British Columbia, 2206 East Mall, Vancouver, British Columbia V6T 1Z3, Canada *S Supporting Information ABSTRACT: Accurate data concerning historical fine particulate matter (PM2.5) concentrations are needed to assess long-term changes in exposure and associated health risks. We estimated historical PM2.5 concentrations over North America from 1981 to 2016 for the first time by combining chemical transport modeling, satellite remote sensing, and ground-based measurements. We constrained and evaluated our estimates with direct ground-based PM2.5 measurements when available and otherwise with historical estimates of PM2.5 from PM10 measurements or total suspended particle (TSP) measurements. The estimated PM2.5 concentrations were generally consistent with direct ground-based PM2.5 measure- ments over their duration from 1988 onward (R2 = 0.6 to 0.85) and to a lesser extent with PM2.5 inferred from PM10 measurements from 1985 to 1998 (R2 = 0.5 to 0.6). The collocated comparison of the trends of population-weighted annual average PM2.5 from our estimates and ground-based measurements was highly consistent (RMSD = 0.66 μg m−3). The population-weighted… -
 2017-01-01 00:00
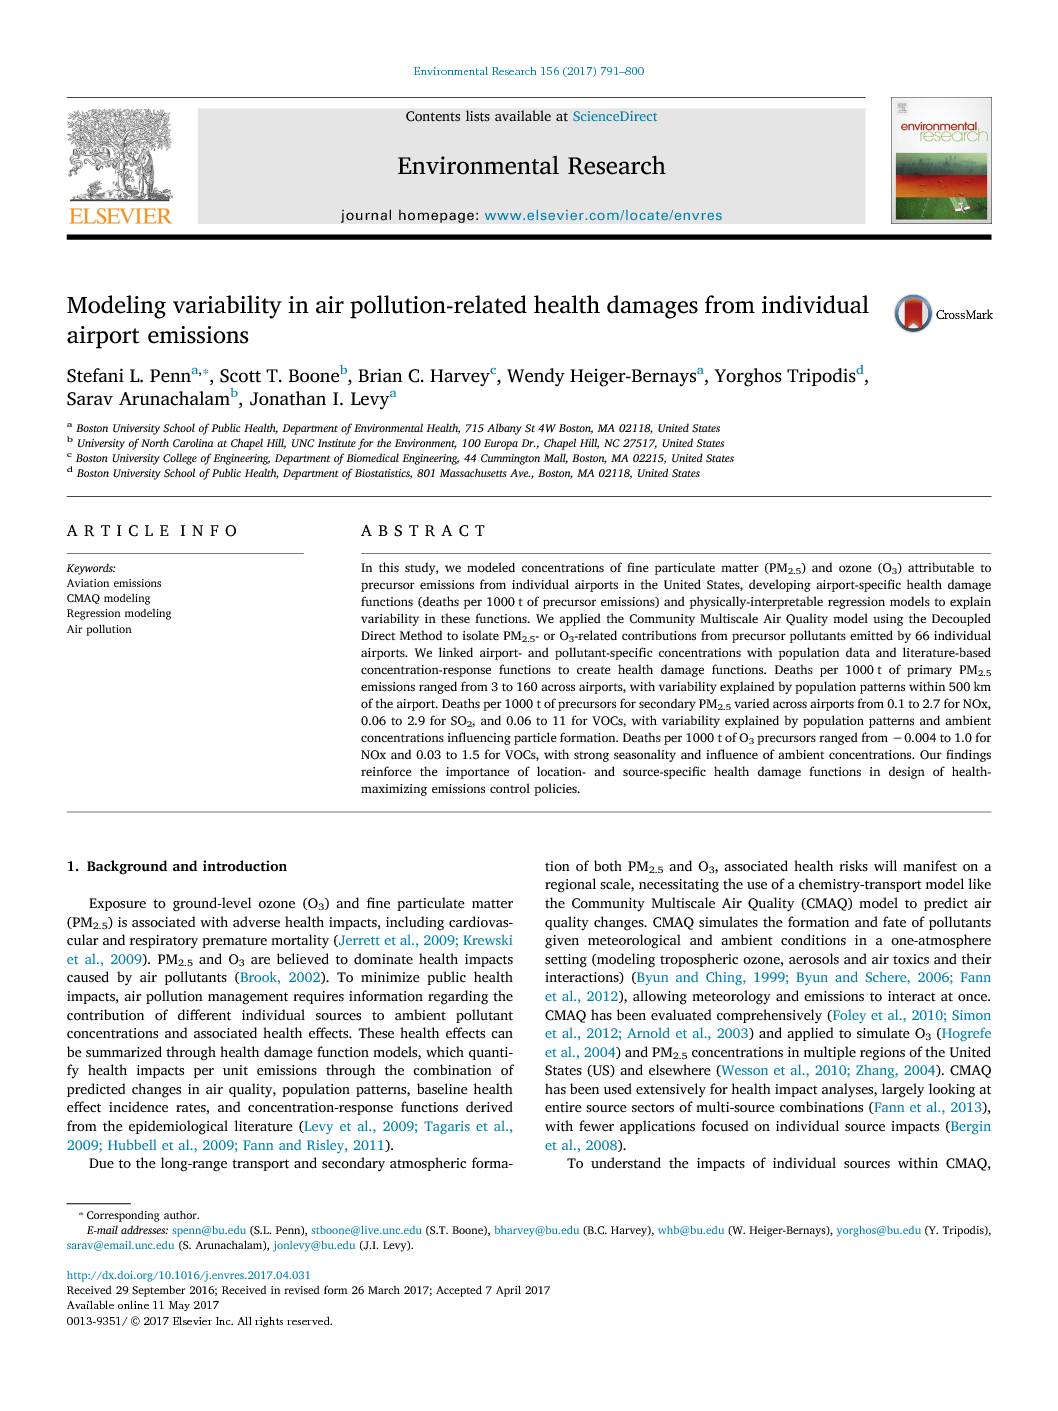
Modeling variability in air pollution-related health damages from individual airport emissions – Stefani L. Penn
Modeling variability in air pollution-related health damages from individual airport emissions Stefani L. Penna,⁎, Scott T. Booneb, Brian C. Harveyc, Wendy Heiger-Bernaysa, Yorghos Tripodisd, Sarav Arunachalamb, Jonathan I. Levya a Boston University School of Public Health, Department of Environmental Health, 715 Albany St 4W Boston, MA 02118, United States b University of North Carolina at Chapel Hill, UNC Institute for the Environment, 100 Europa Dr., Chapel Hill, NC 27517, United States c Boston University College of Engineering, Department of Biomedical Engineering, 44 Cummington Mall, Boston, MA 02215, United States d Boston University School of Public Health, Department of Biostatistics, 801 Massachusetts Ave., Boston, MA 02118, United States A R T I C L E I N F O Keywords: Aviation emissions CMAQ modeling Regression modeling Air pollution A B S T R A C T In this study, we modeled concentrations of fine particulate matter (PM2.5) and ozone (O3) attributable to precursor emissions from individual airports in the United States, developing airport-specific health damage functions (deaths per 1000 t of precursor emissions) and physically-interpretable regression models to explain variability in these functions. We applied the Community Multiscale Air Quality model using the Decoupled Direct Method to isolate PM2.5- or O3-related contributions from precursor pollutants emitted by 66 individual airports. We linked airport- and pollutant-specific concentrations with population data and literature-based concentration-response functions to create health damage functions. Deaths per 1000 t of primary PM2.5 emissions ranged from 3 to 160 across airports, with variability explained by population patterns within 500…