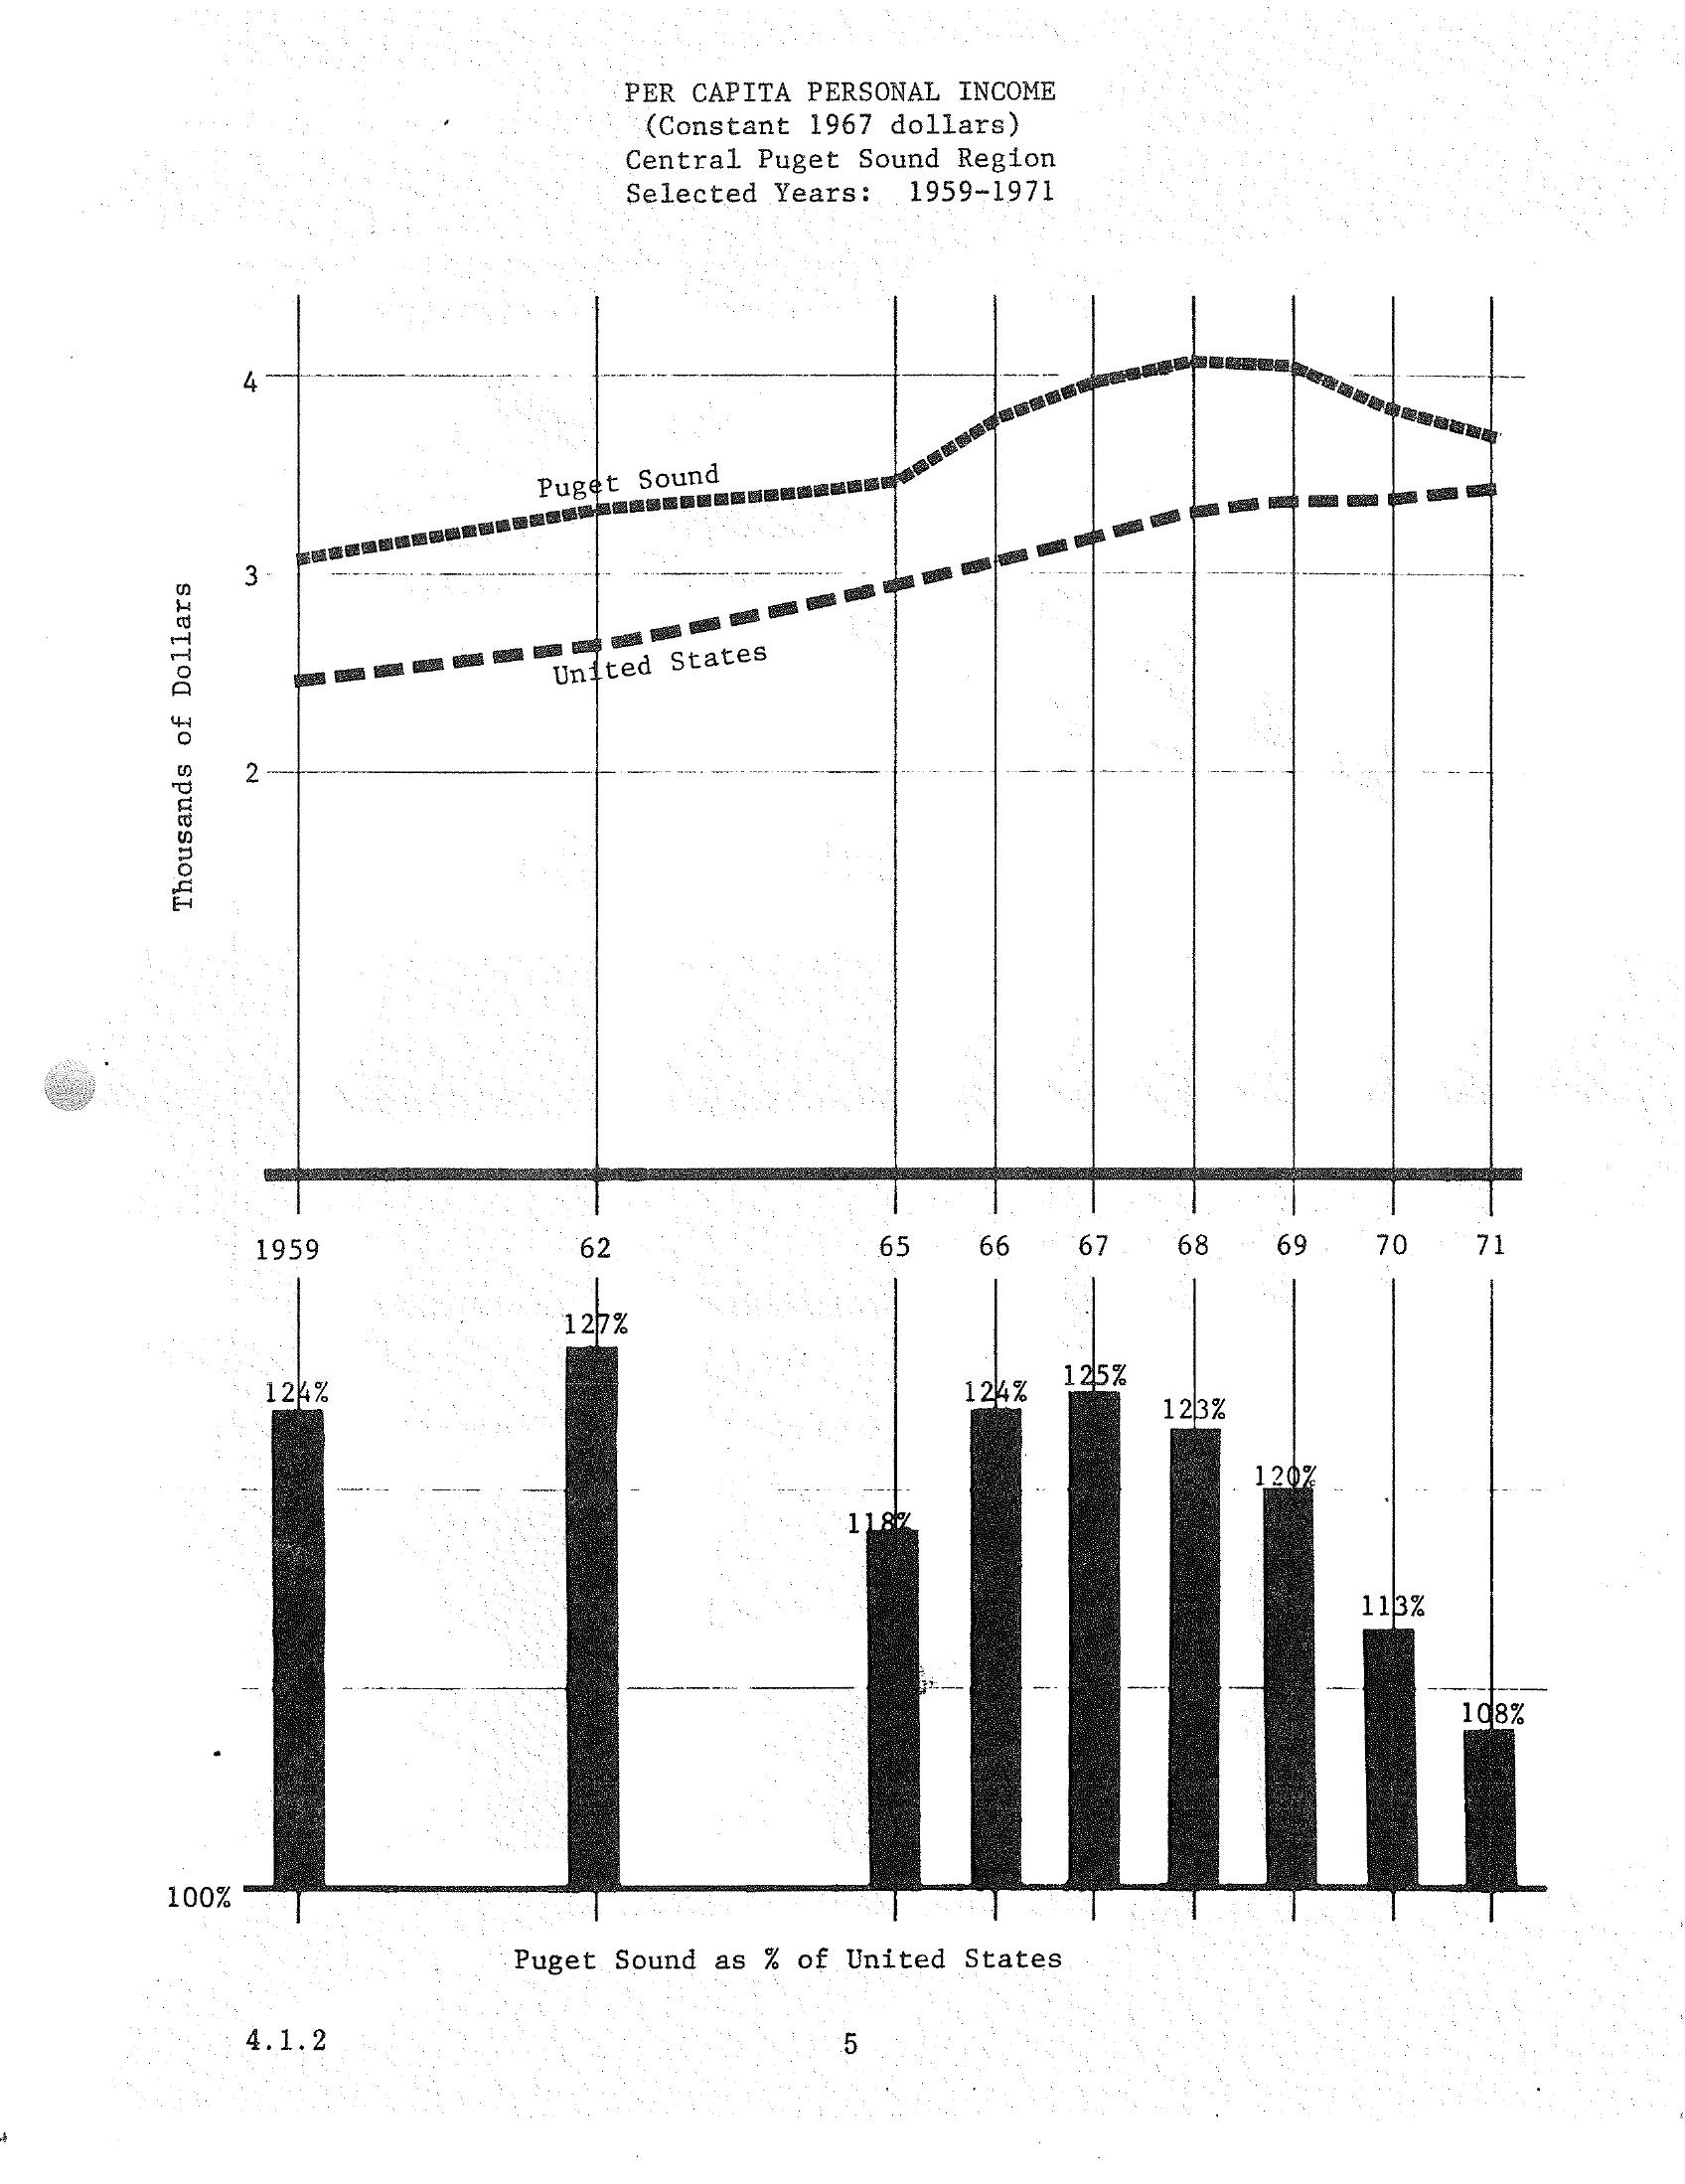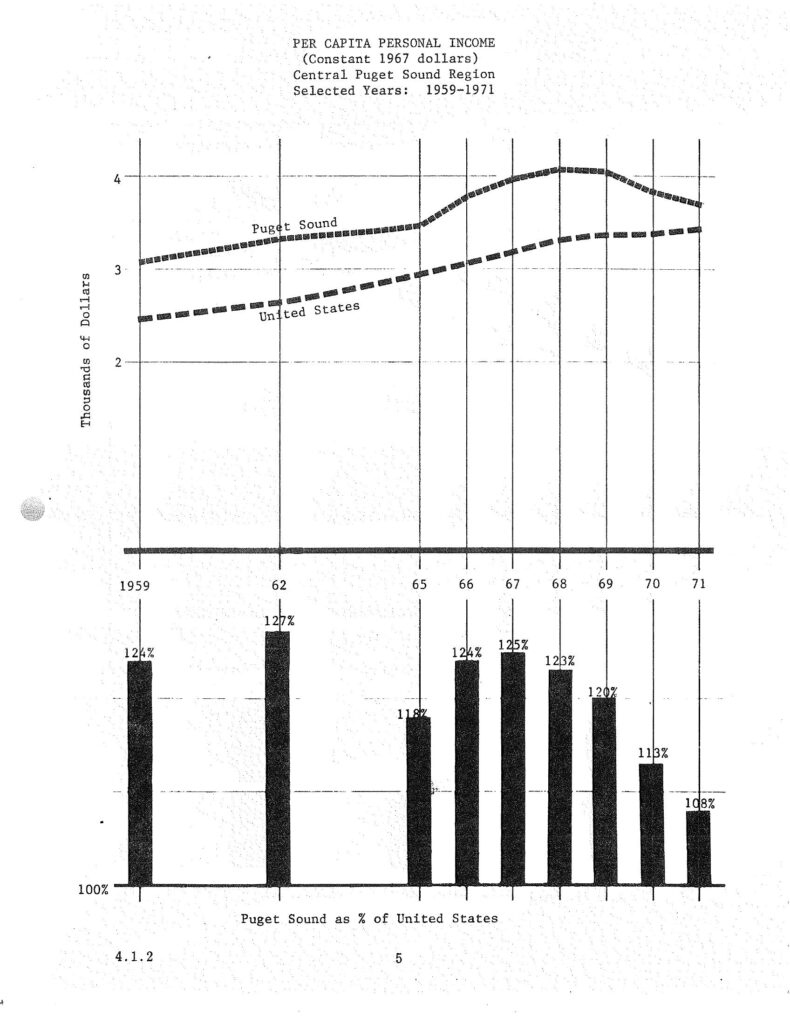
A dual-panel chart showing per capita personal income in constant 1967 dollars for the Central Puget Sound Region compared to the United States for selected years 1959–1971. The lower bar chart expresses Puget Sound income as a percentage of the U.S. figure, peaking at 127% in 1962 and declining to 108% by 1971, labeled as figure 4.1.2.Open full document
Notes
A dual-panel chart showing per capita personal income in constant 1967 dollars for the Central Puget Sound Region compared to the United States for selected years 1959–1971. The lower bar chart expresses Puget Sound income as a percentage of the U.S. figure, peaking at 127% in 1962 and declining to 108% by 1971, labeled as figure 4.1.2.