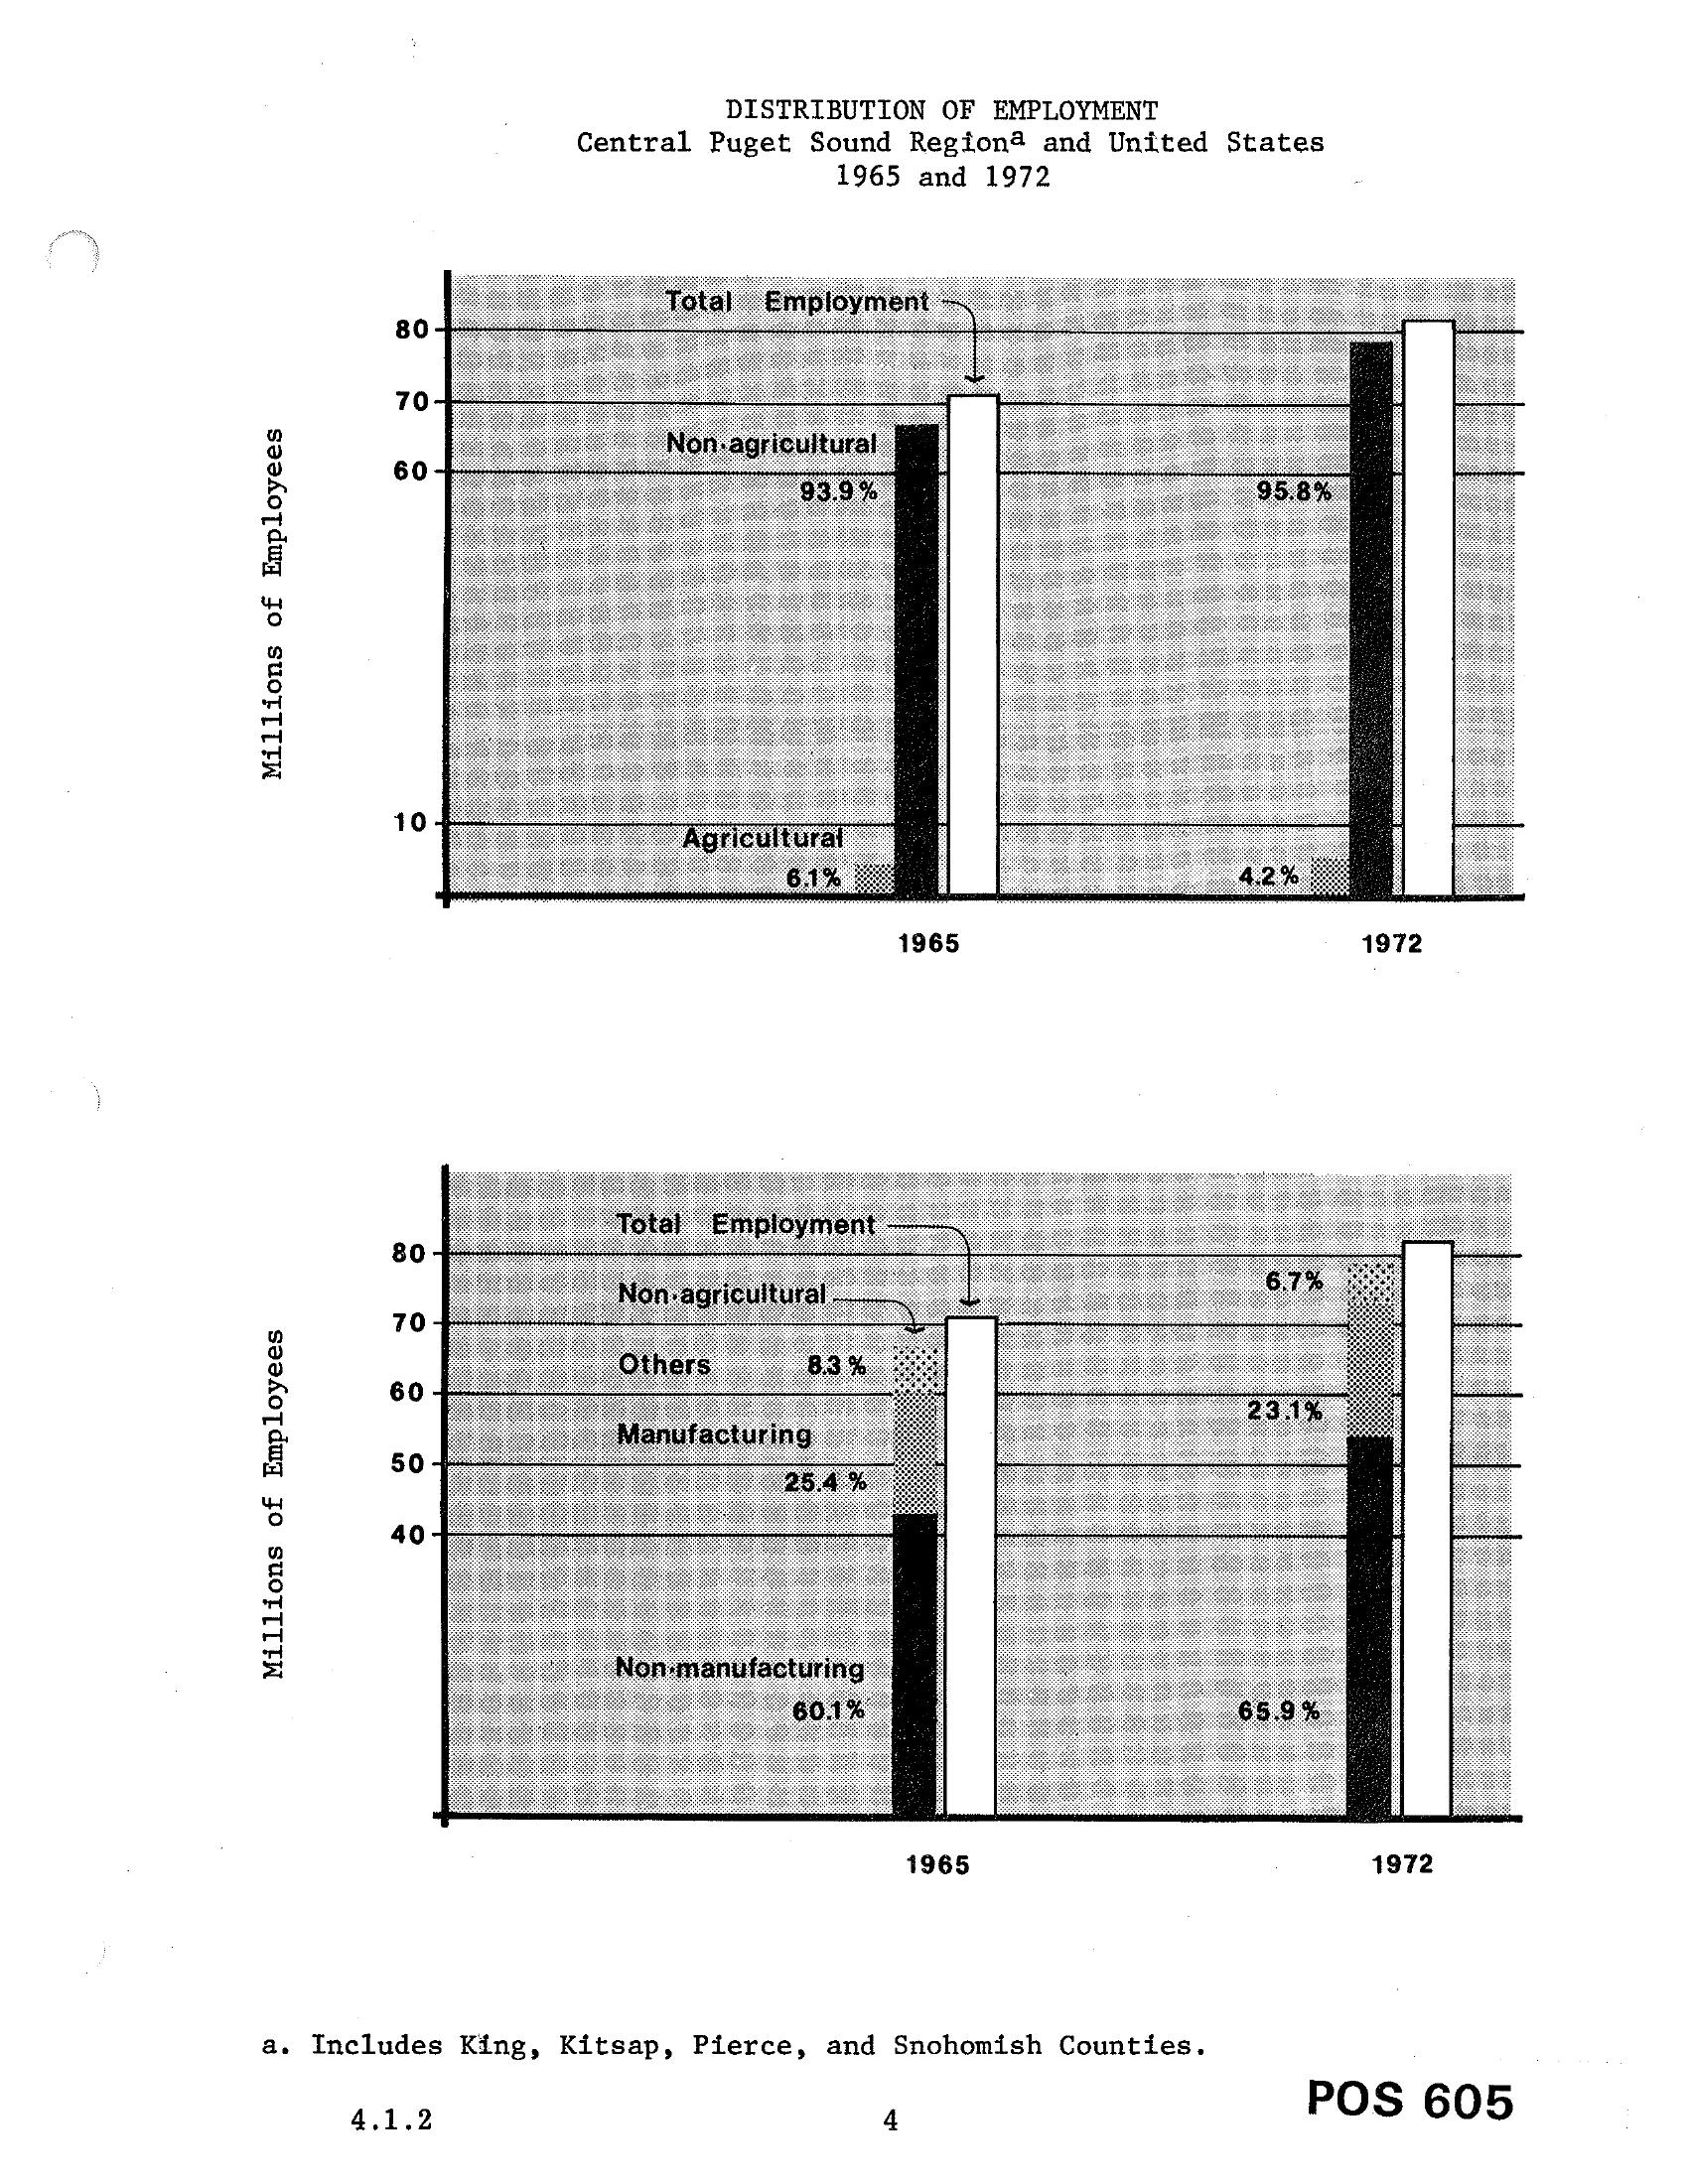
Two bar charts (document POS 605, page 4.1.2) compare employment distribution between 1965 and 1972 for the Central Puget Sound Region (King, Kitsap, Pierce, and Snohomish Counties) and the United States. The upper chart shows agricultural vs. non-agricultural employment shares, while the lower chart breaks non-agricultural employment into non-manufacturing (60.1% to 65.9%), manufacturing (25.4% to 23.1%), and others (8.3% to 6.7%).Open full document
Notes
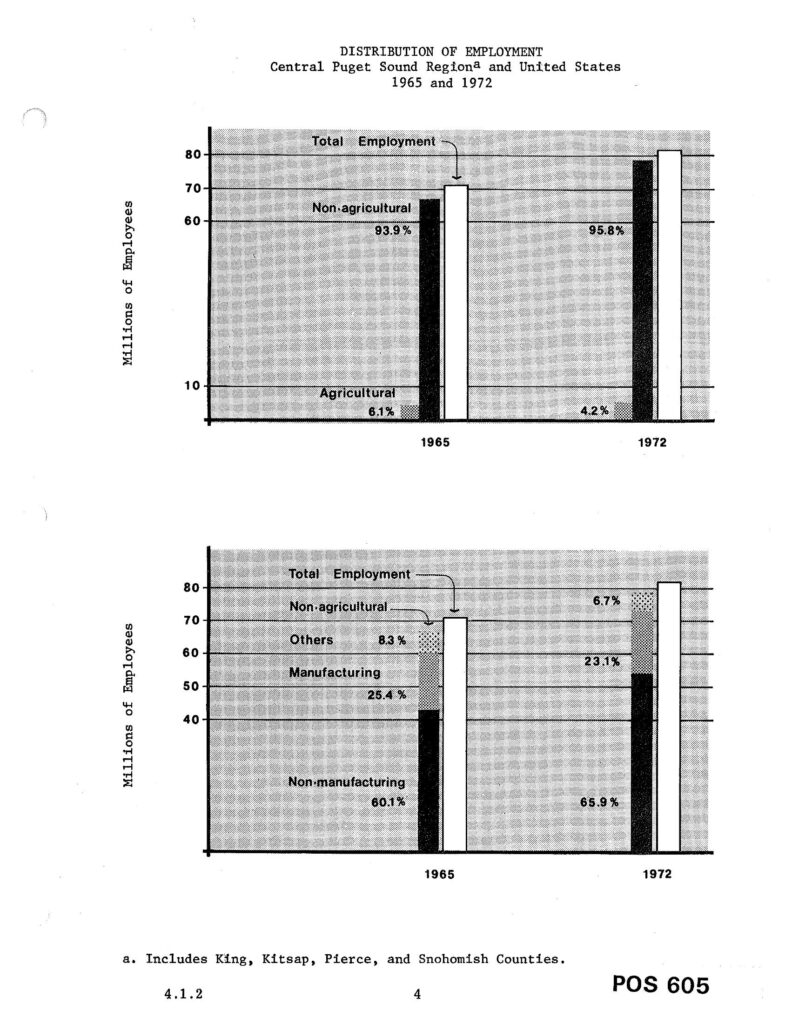
Two bar charts (document POS 605, page 4.1.2) compare employment distribution between 1965 and 1972 for the Central Puget Sound Region (King, Kitsap, Pierce, and Snohomish Counties) and the United States. The upper chart shows agricultural vs. non-agricultural employment shares, while the lower chart breaks non-agricultural employment into non-manufacturing (60.1% to 65.9%), manufacturing (25.4% to 23.1%), and others (8.3% to 6.7%).