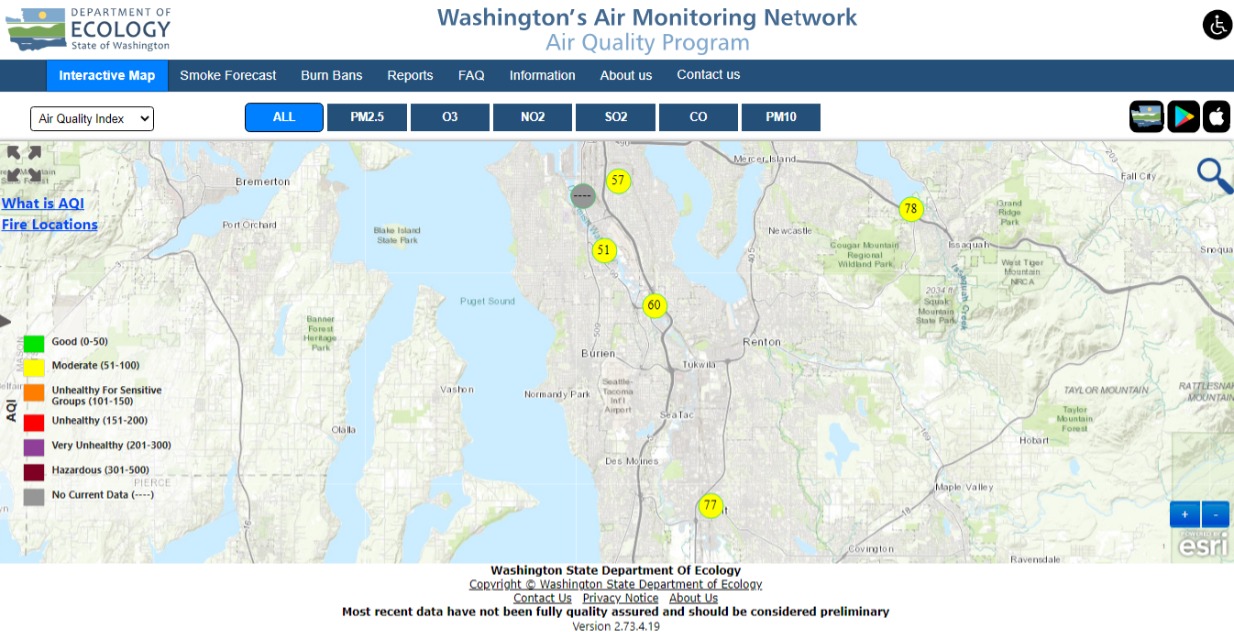
Screenshot of Washington State Department of Ecology's Air Quality Monitoring Network interactive map showing AQI readings across the greater Seattle–Sea-Tac area, with moderate-range values (51–100, yellow) displayed at multiple monitoring stations including readings of 51, 57, 60, 77, and 78. The map is produced by the Washington State Department of Ecology Air Quality Program and powered by Esri.Open full document
Notes
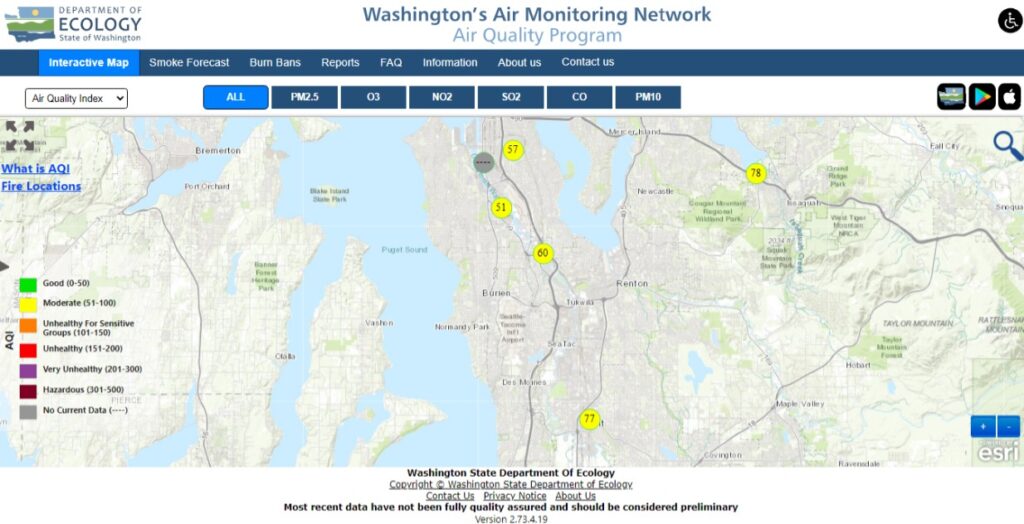
Screenshot of Washington State Department of Ecology’s Air Quality Monitoring Network interactive map showing AQI readings across the greater Seattle–Sea-Tac area, with moderate-range values (51–100, yellow) displayed at multiple monitoring stations including readings of 51, 57, 60, 77, and 78. The map is produced by the Washington State Department of Ecology Air Quality Program and powered by Esri.