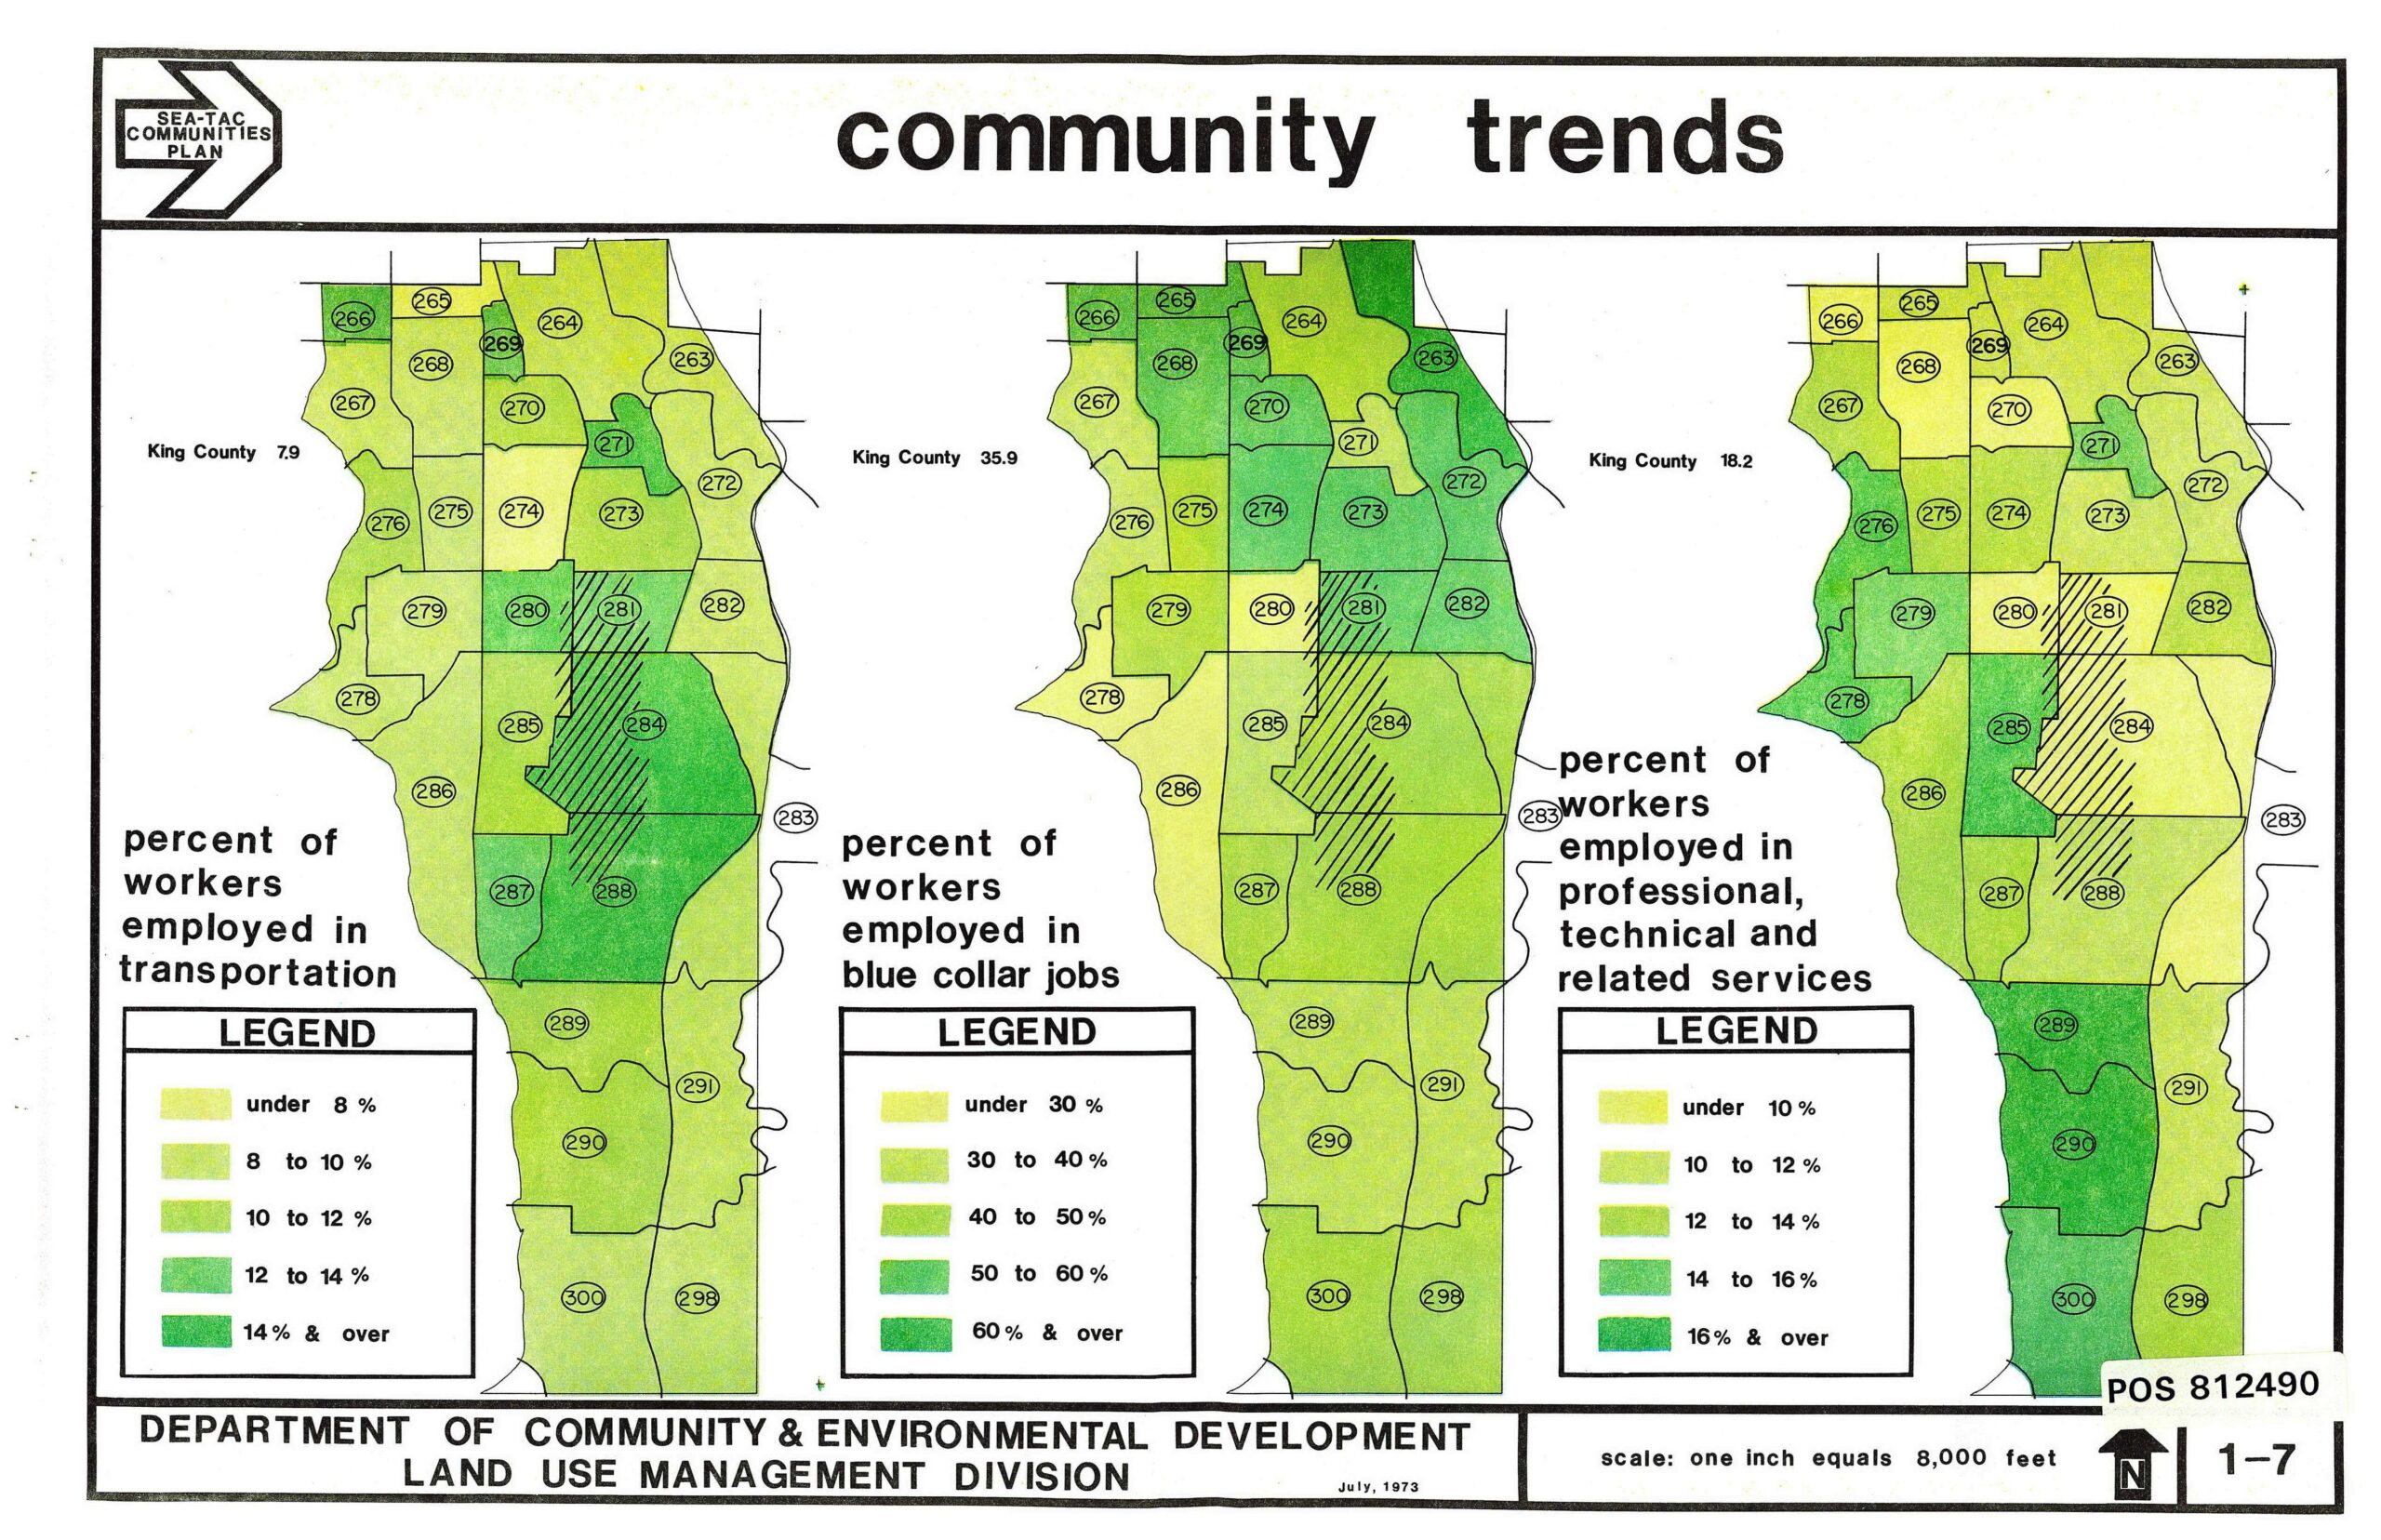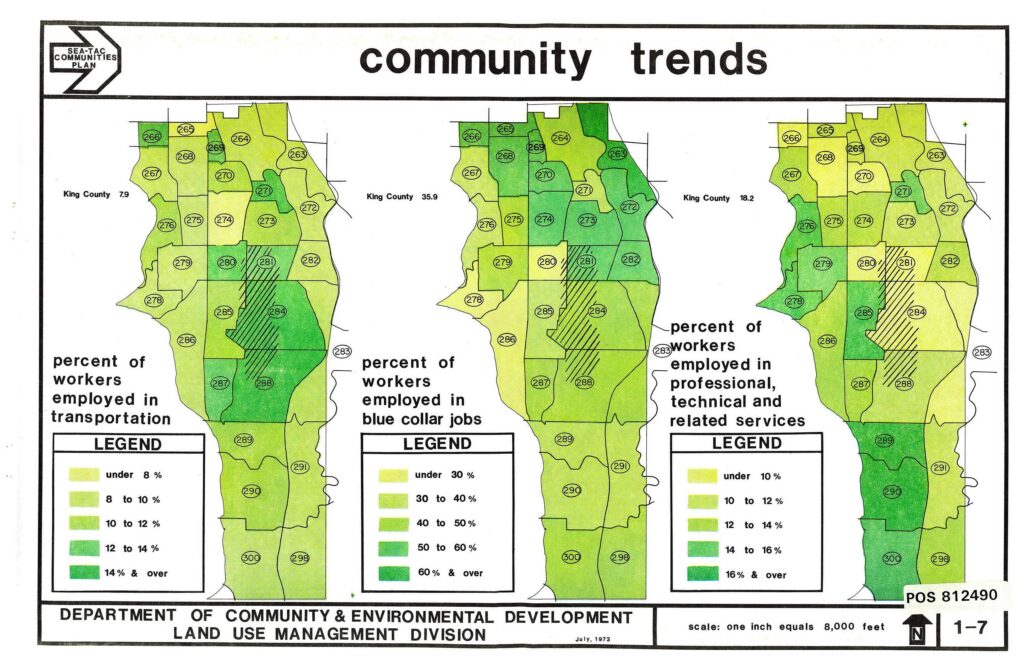
A planning document produced by King County's Department of Community & Environmental Development, Land Use Management Division in July 1973, showing three choropleth maps of Sea-Tac area census tracts depicting percent of workers employed in transportation, blue-collar jobs, and professional/technical services respectively. King County averages are noted as 7.9%, 35.9%, and 18.2% for each category, with document reference number POS 812490.Open full document
Notes
A planning document produced by King County’s Department of Community & Environmental Development, Land Use Management Division in July 1973, showing three choropleth maps of Sea-Tac area census tracts depicting percent of workers employed in transportation, blue-collar jobs, and professional/technical services respectively. King County averages are noted as 7.9%, 35.9%, and 18.2% for each category, with document reference number POS 812490.