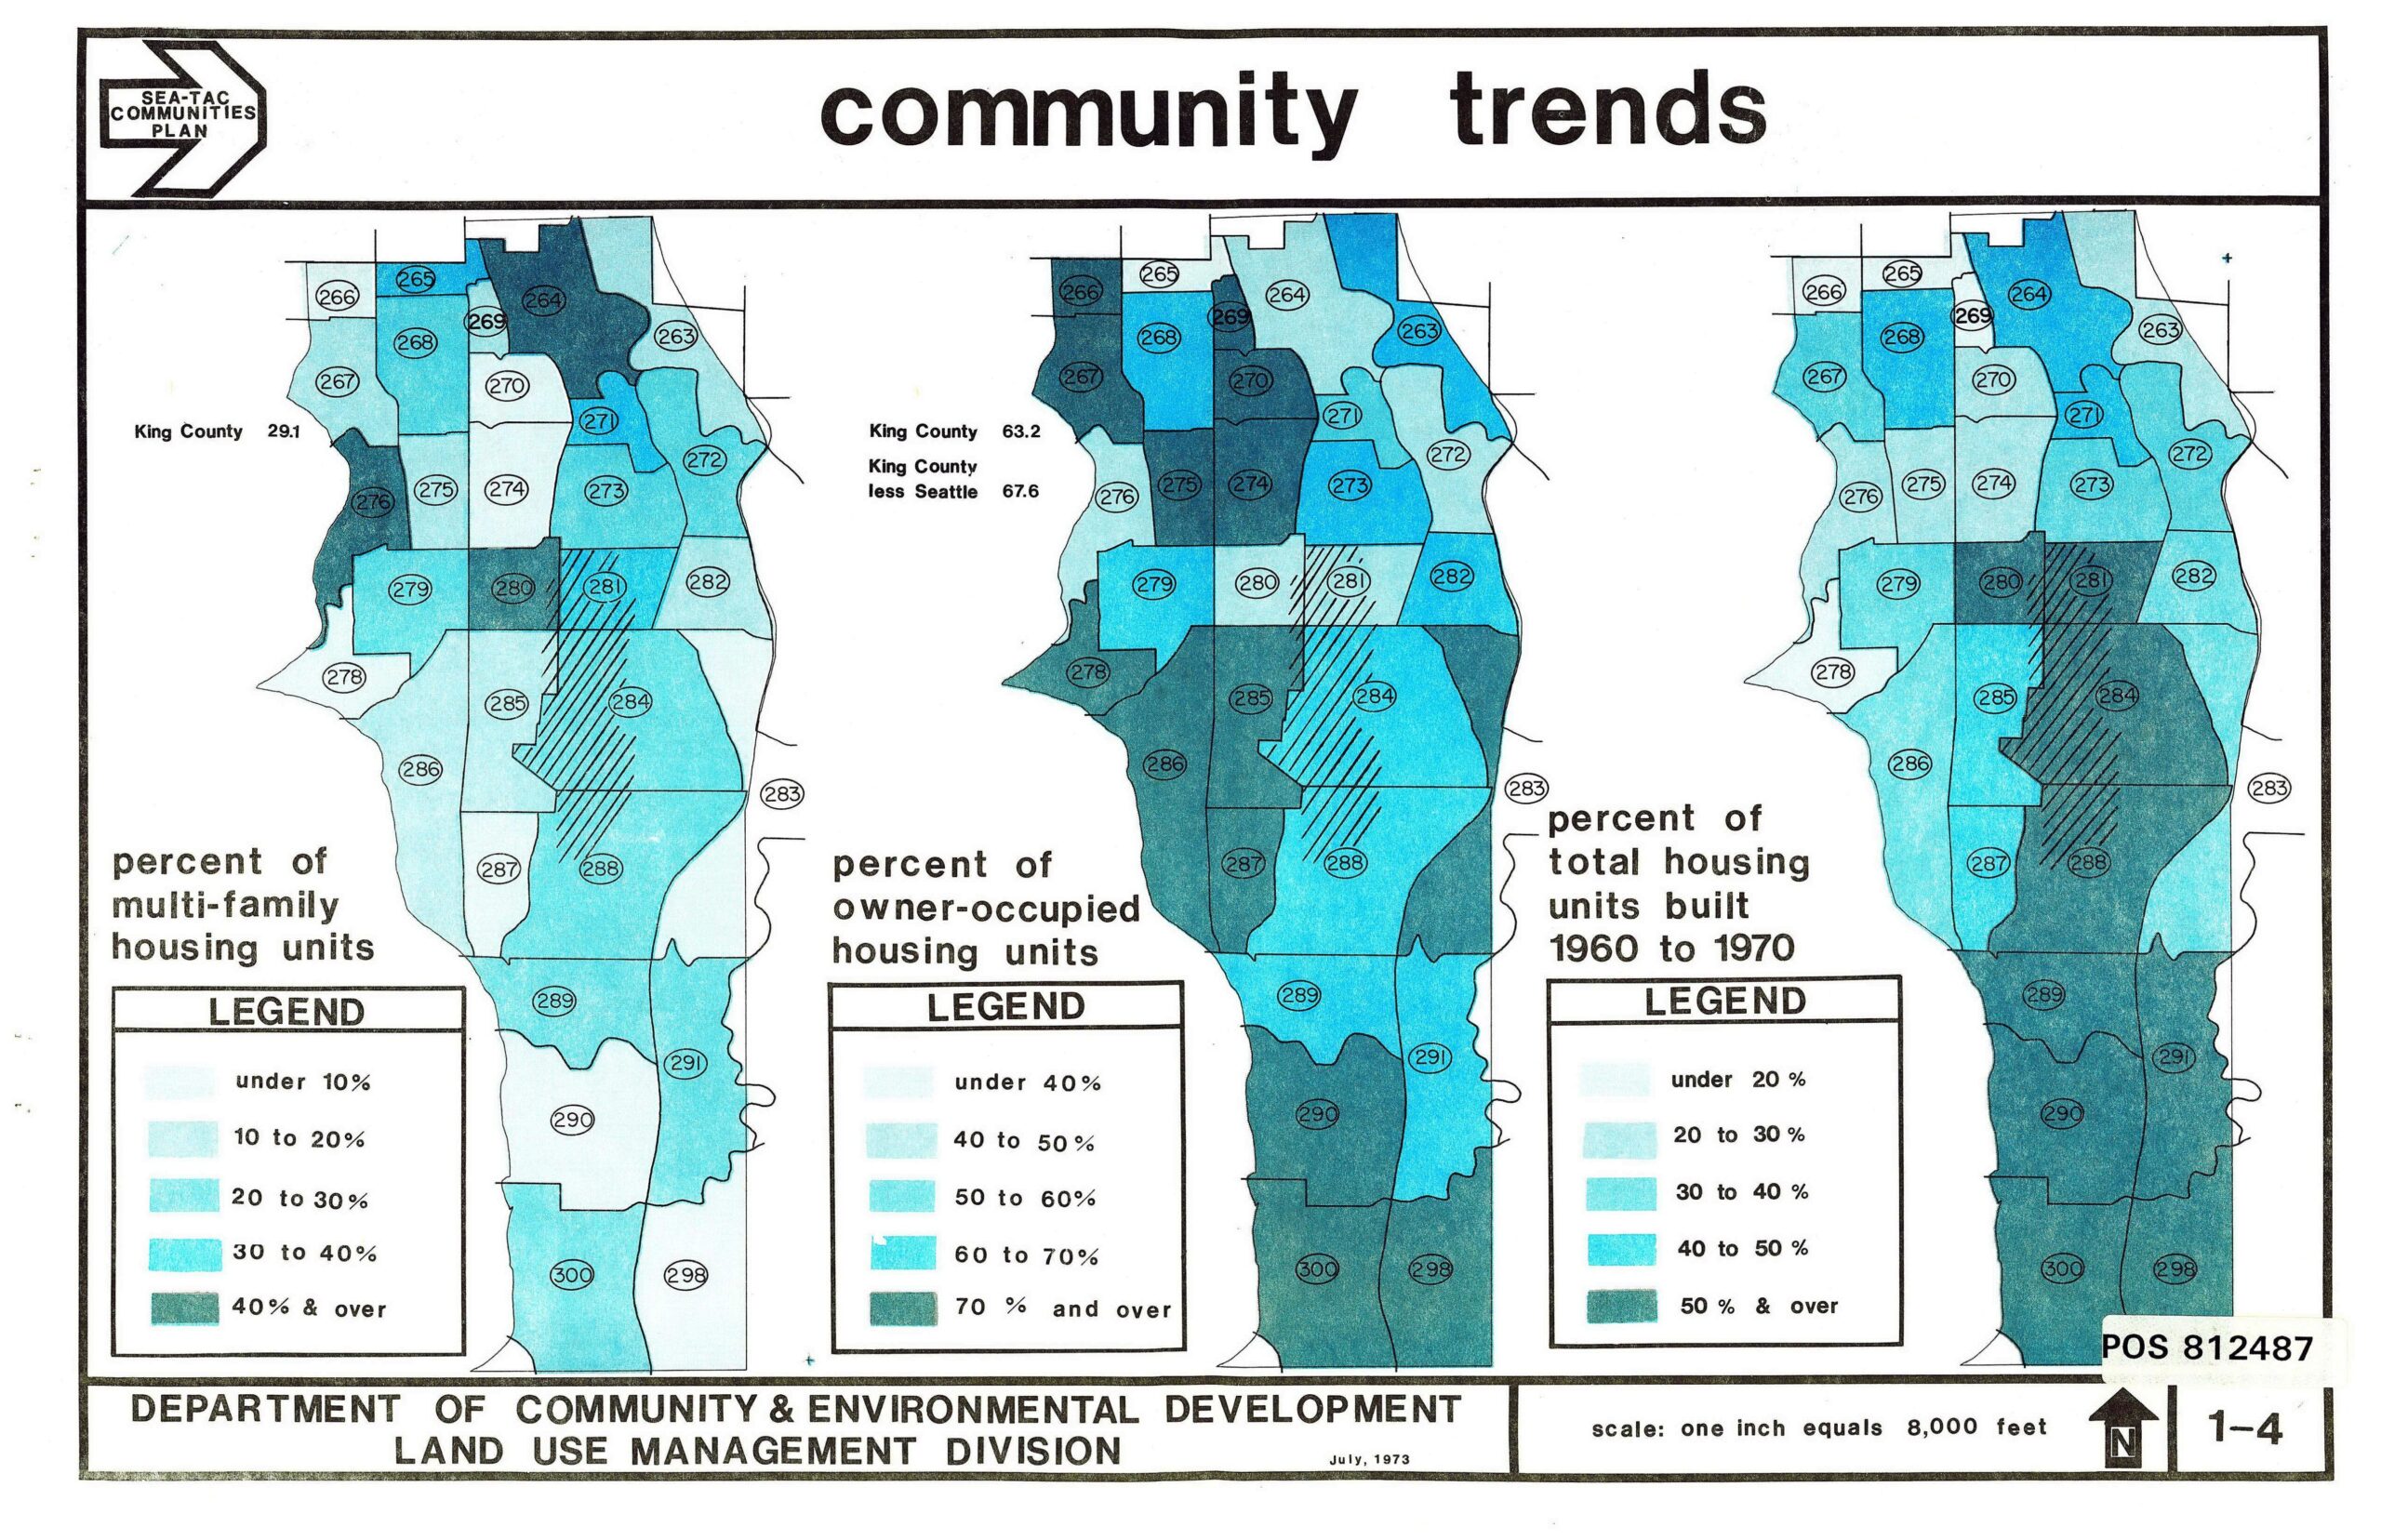
A three-panel choropleth map (document POS 812487, sheet 1-4) produced by King County's Department of Community & Environmental Development, Land Use Management Division, dated July 1973. The maps display census-tract-level data for the Sea-Tac communities on percent of multi-family housing units, percent of owner-occupied housing units (King County average 63.2%, King County less Seattle 67.6%), and percent of total housing units built 1960–1970, at a scale of one inch equals 8,000 feet.Open full document
Notes
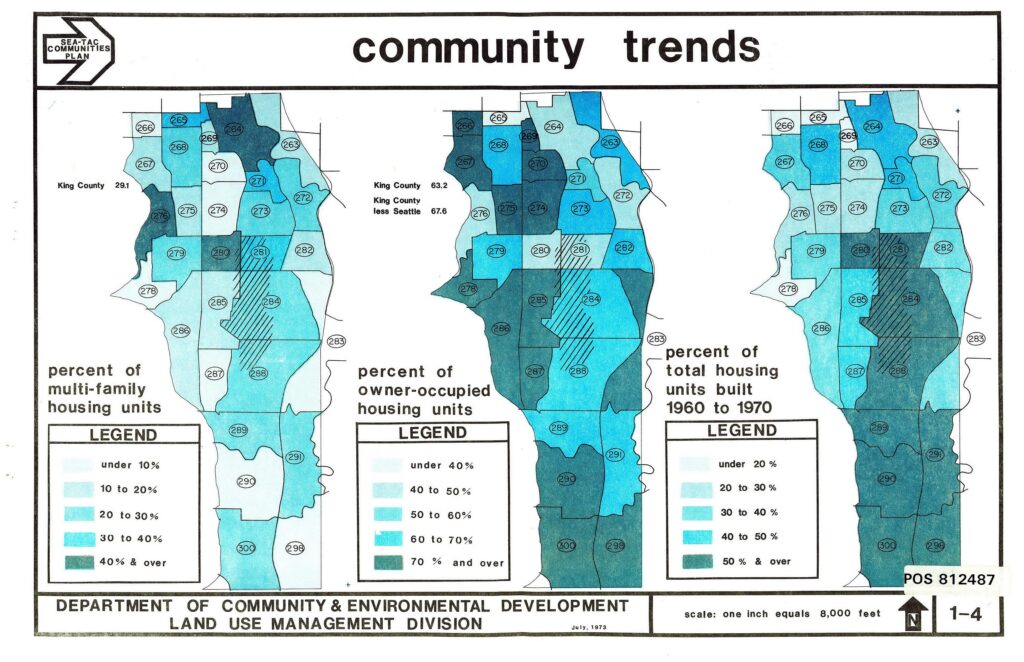
A three-panel choropleth map (document POS 812487, sheet 1-4) produced by King County’s Department of Community & Environmental Development, Land Use Management Division, dated July 1973. The maps display census-tract-level data for the Sea-Tac communities on percent of multi-family housing units, percent of owner-occupied housing units (King County average 63.2%, King County less Seattle 67.6%), and percent of total housing units built 1960–1970, at a scale of one inch equals 8,000 feet.