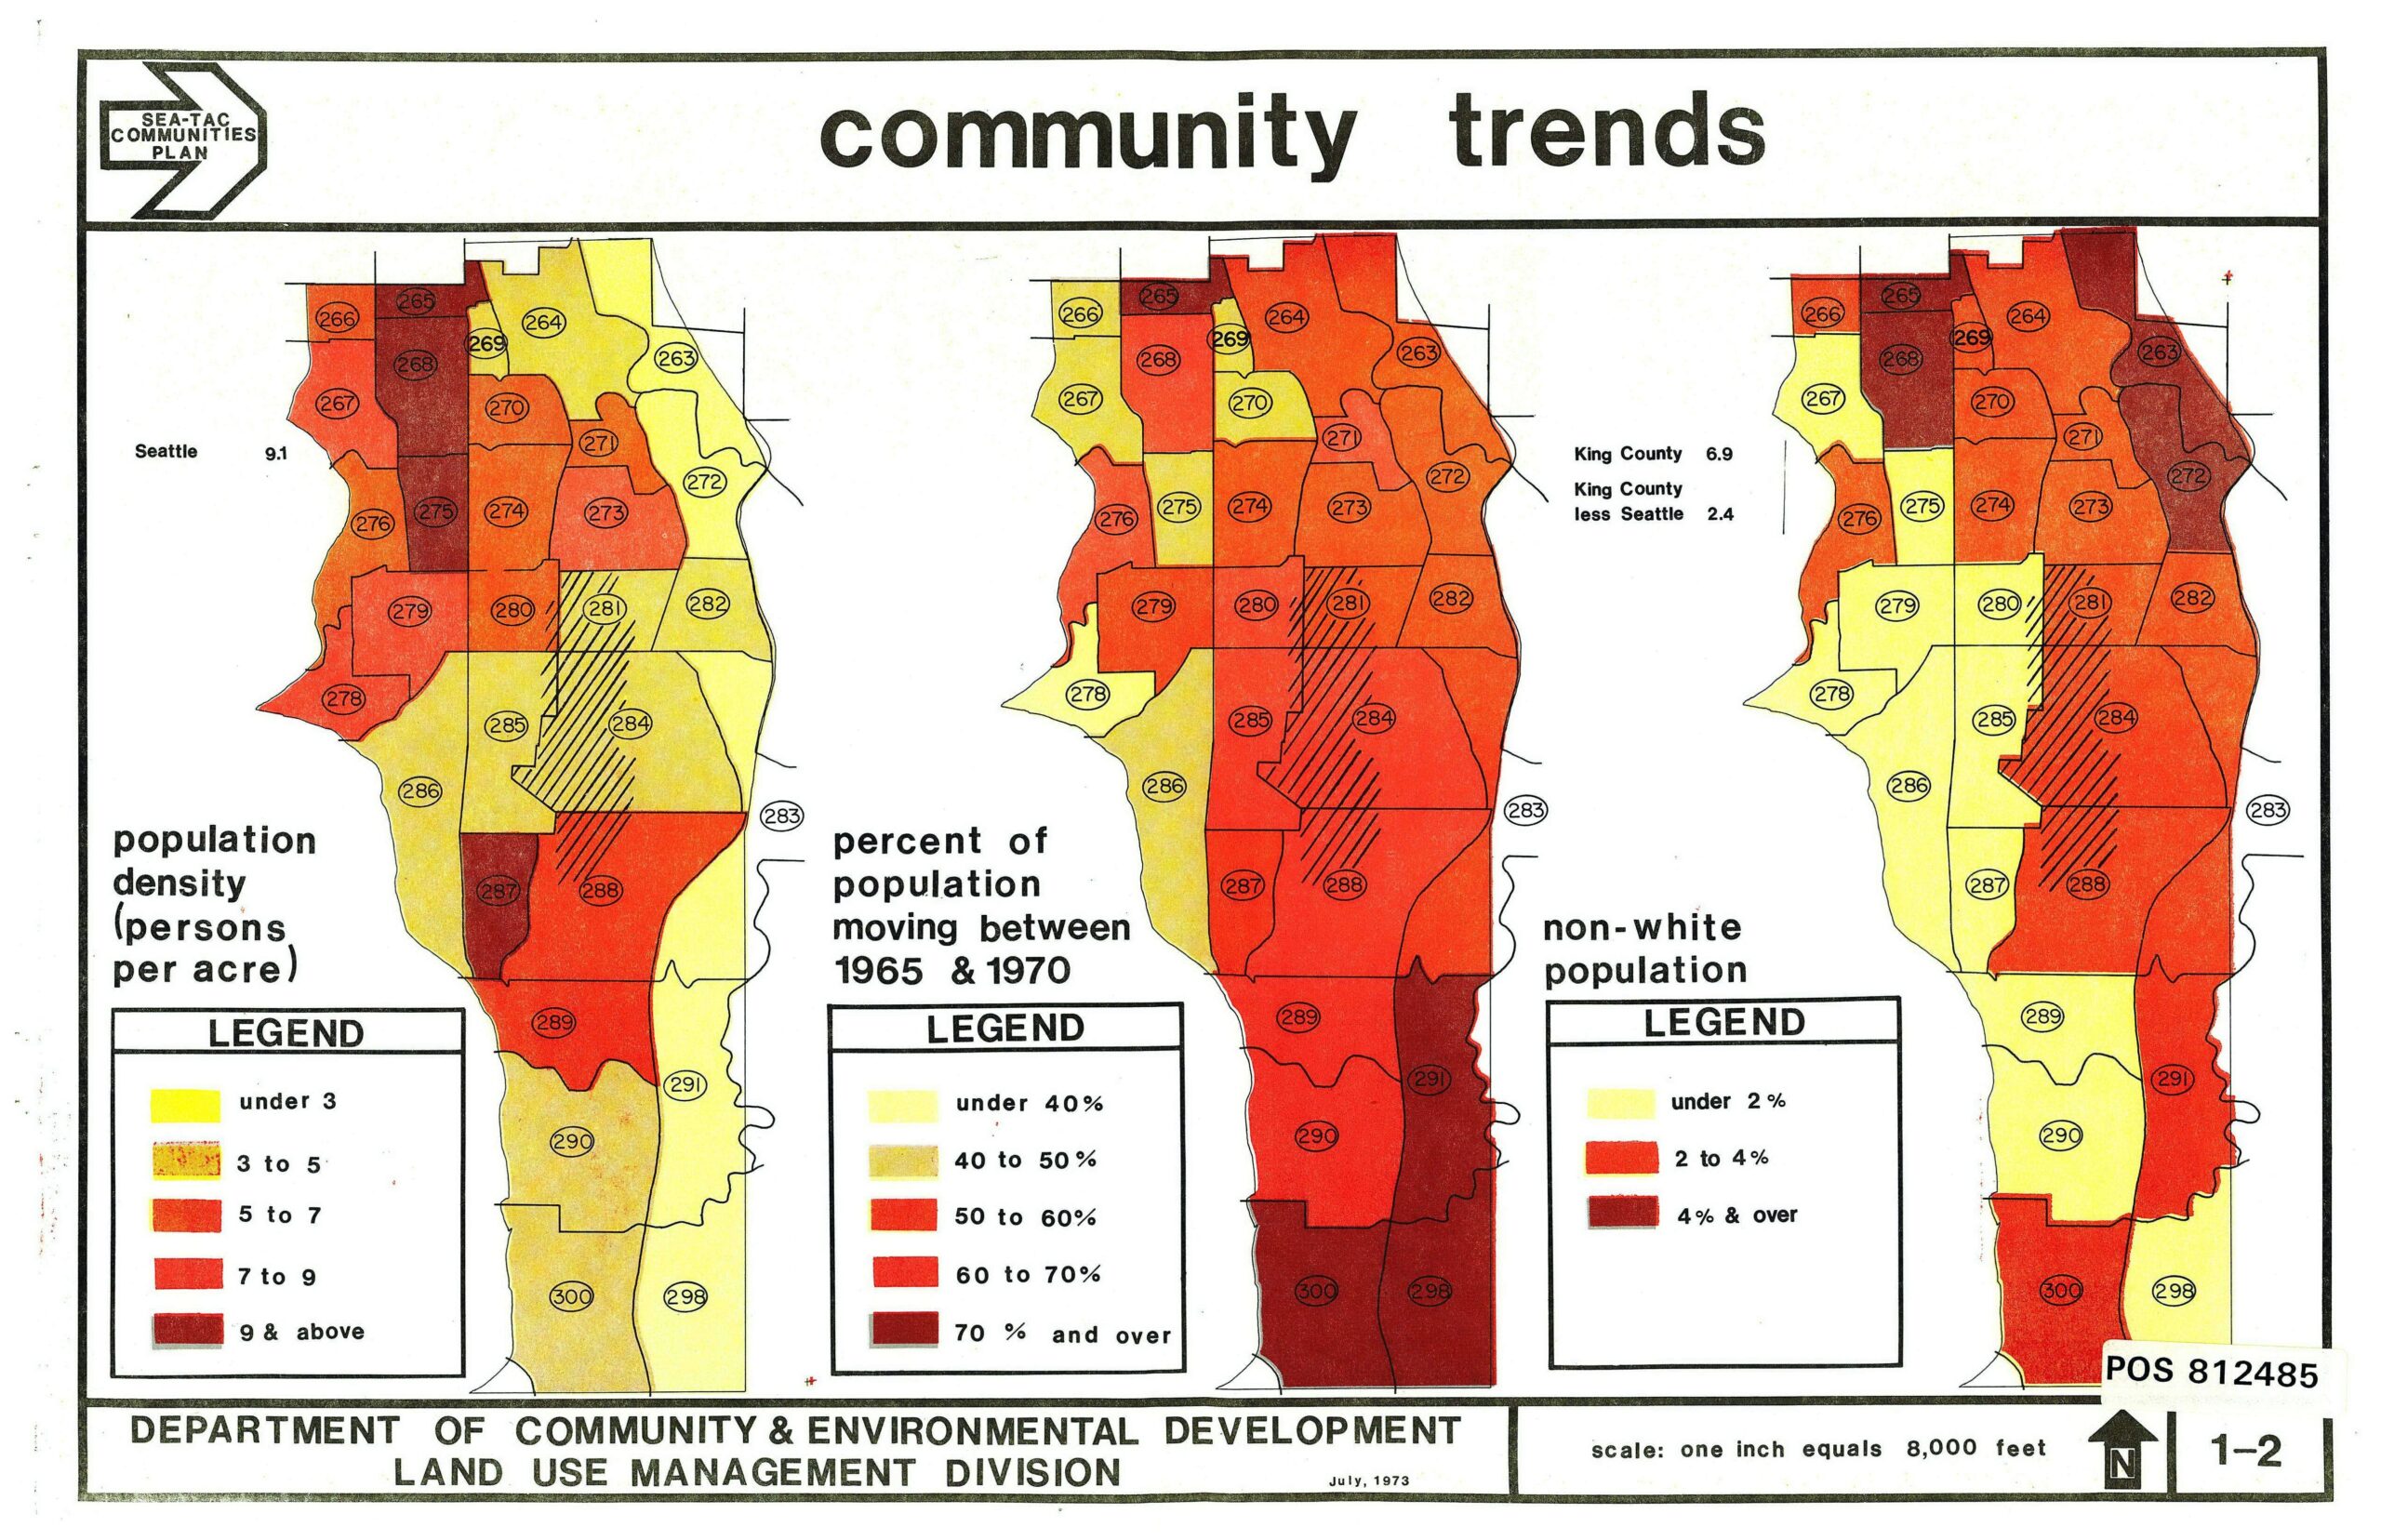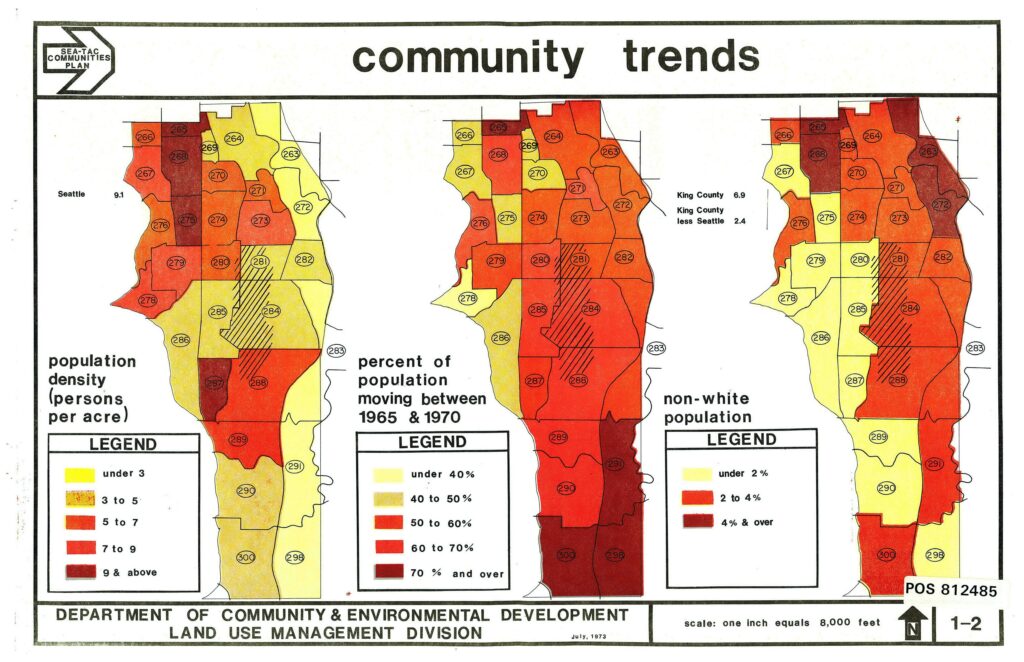
A planning document produced by King County's Department of Community & Environmental Development, Land Use Management Division (July 1973), showing three choropleth maps of the Sea-Tac area census tracts (numbered 263–300). The maps display population density (persons per acre), percent of population that moved between 1965 and 1970, and non-white population percentage, with reference figures noting Seattle at 9.1 and King County at 6.9 persons per acre.Open full document
Notes
A planning document produced by King County’s Department of Community & Environmental Development, Land Use Management Division (July 1973), showing three choropleth maps of the Sea-Tac area census tracts (numbered 263–300). The maps display population density (persons per acre), percent of population that moved between 1965 and 1970, and non-white population percentage, with reference figures noting Seattle at 9.1 and King County at 6.9 persons per acre.