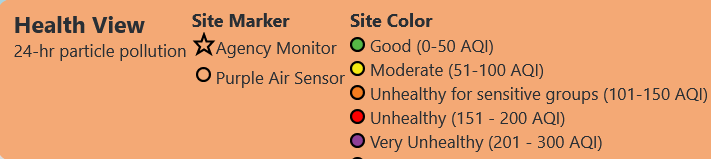
A legend graphic explaining a 'Health View' map display for 24-hour particle pollution, showing two site marker types (Agency Monitor and Purple Air Sensor) and five AQI color categories ranging from Good (0-50) to Very Unhealthy (201-300). No specific organization, date, or geographic attribution is visible in the image.Open full document
Notes
A legend graphic explaining a ‘Health View’ map display for 24-hour particle pollution, showing two site marker types (Agency Monitor and Purple Air Sensor) and five AQI color categories ranging from Good (0-50) to Very Unhealthy (201-300). No specific organization, date, or geographic attribution is visible in the image.