Notes
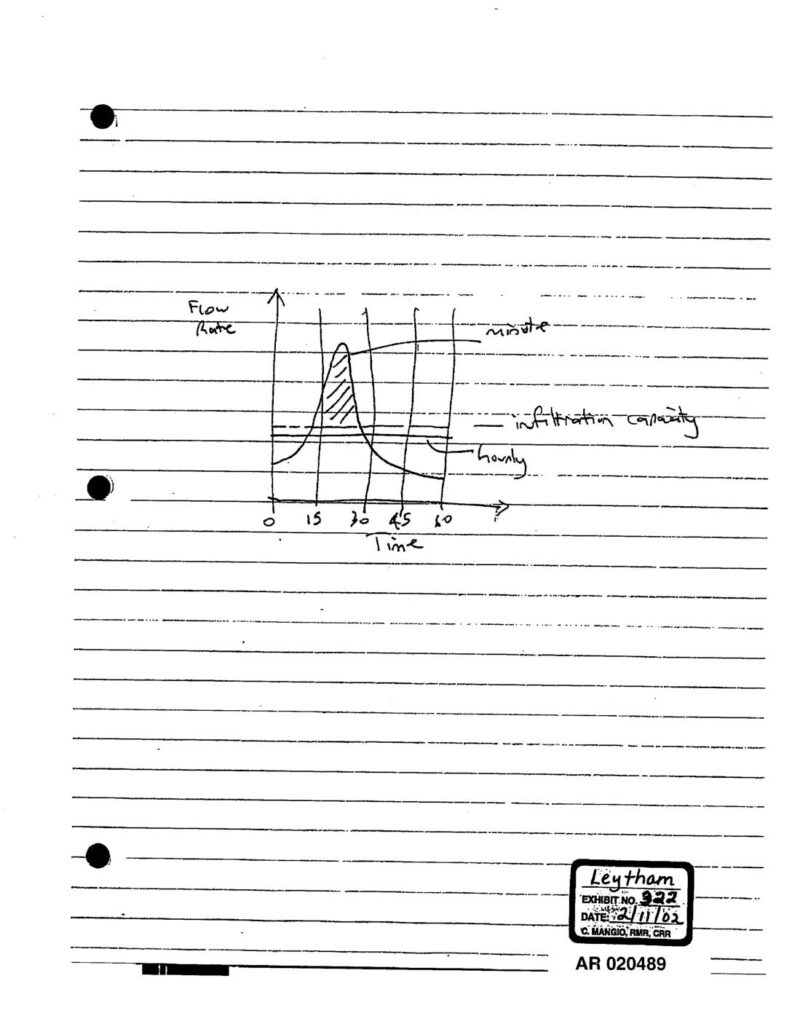
A hand-drawn graph showing flow rate over time with three curves: minute, hourly, and infiltration capacity. The diagram illustrates the relationship between flow rates at different time scales and infiltration capacity, with a hatched area indicating excess flow above infiltration capacity. This appears to be a hydrological sketch used as a legal exhibit.