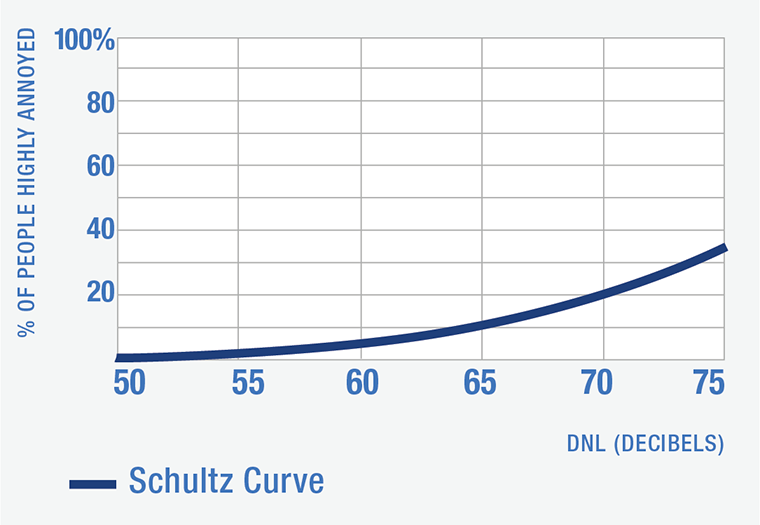
This graph displays the Schultz Curve, which plots the percentage of people highly annoyed (y-axis, 0–100%) against Day-Night Average Sound Level (DNL) in decibels (x-axis, 50–75 dB). The curve shows an exponential increase in annoyance, rising from approximately 3–4% at 50 dB DNL to approximately 33% at 75 dB DNL, a standard reference used in airport noise policy analysis.Open full document
Notes
This graph displays the Schultz Curve, which plots the percentage of people highly annoyed (y-axis, 0–100%) against Day-Night Average Sound Level (DNL) in decibels (x-axis, 50–75 dB). The curve shows an exponential increase in annoyance, rising from approximately 3–4% at 50 dB DNL to approximately 33% at 75 dB DNL, a standard reference used in airport noise policy analysis.