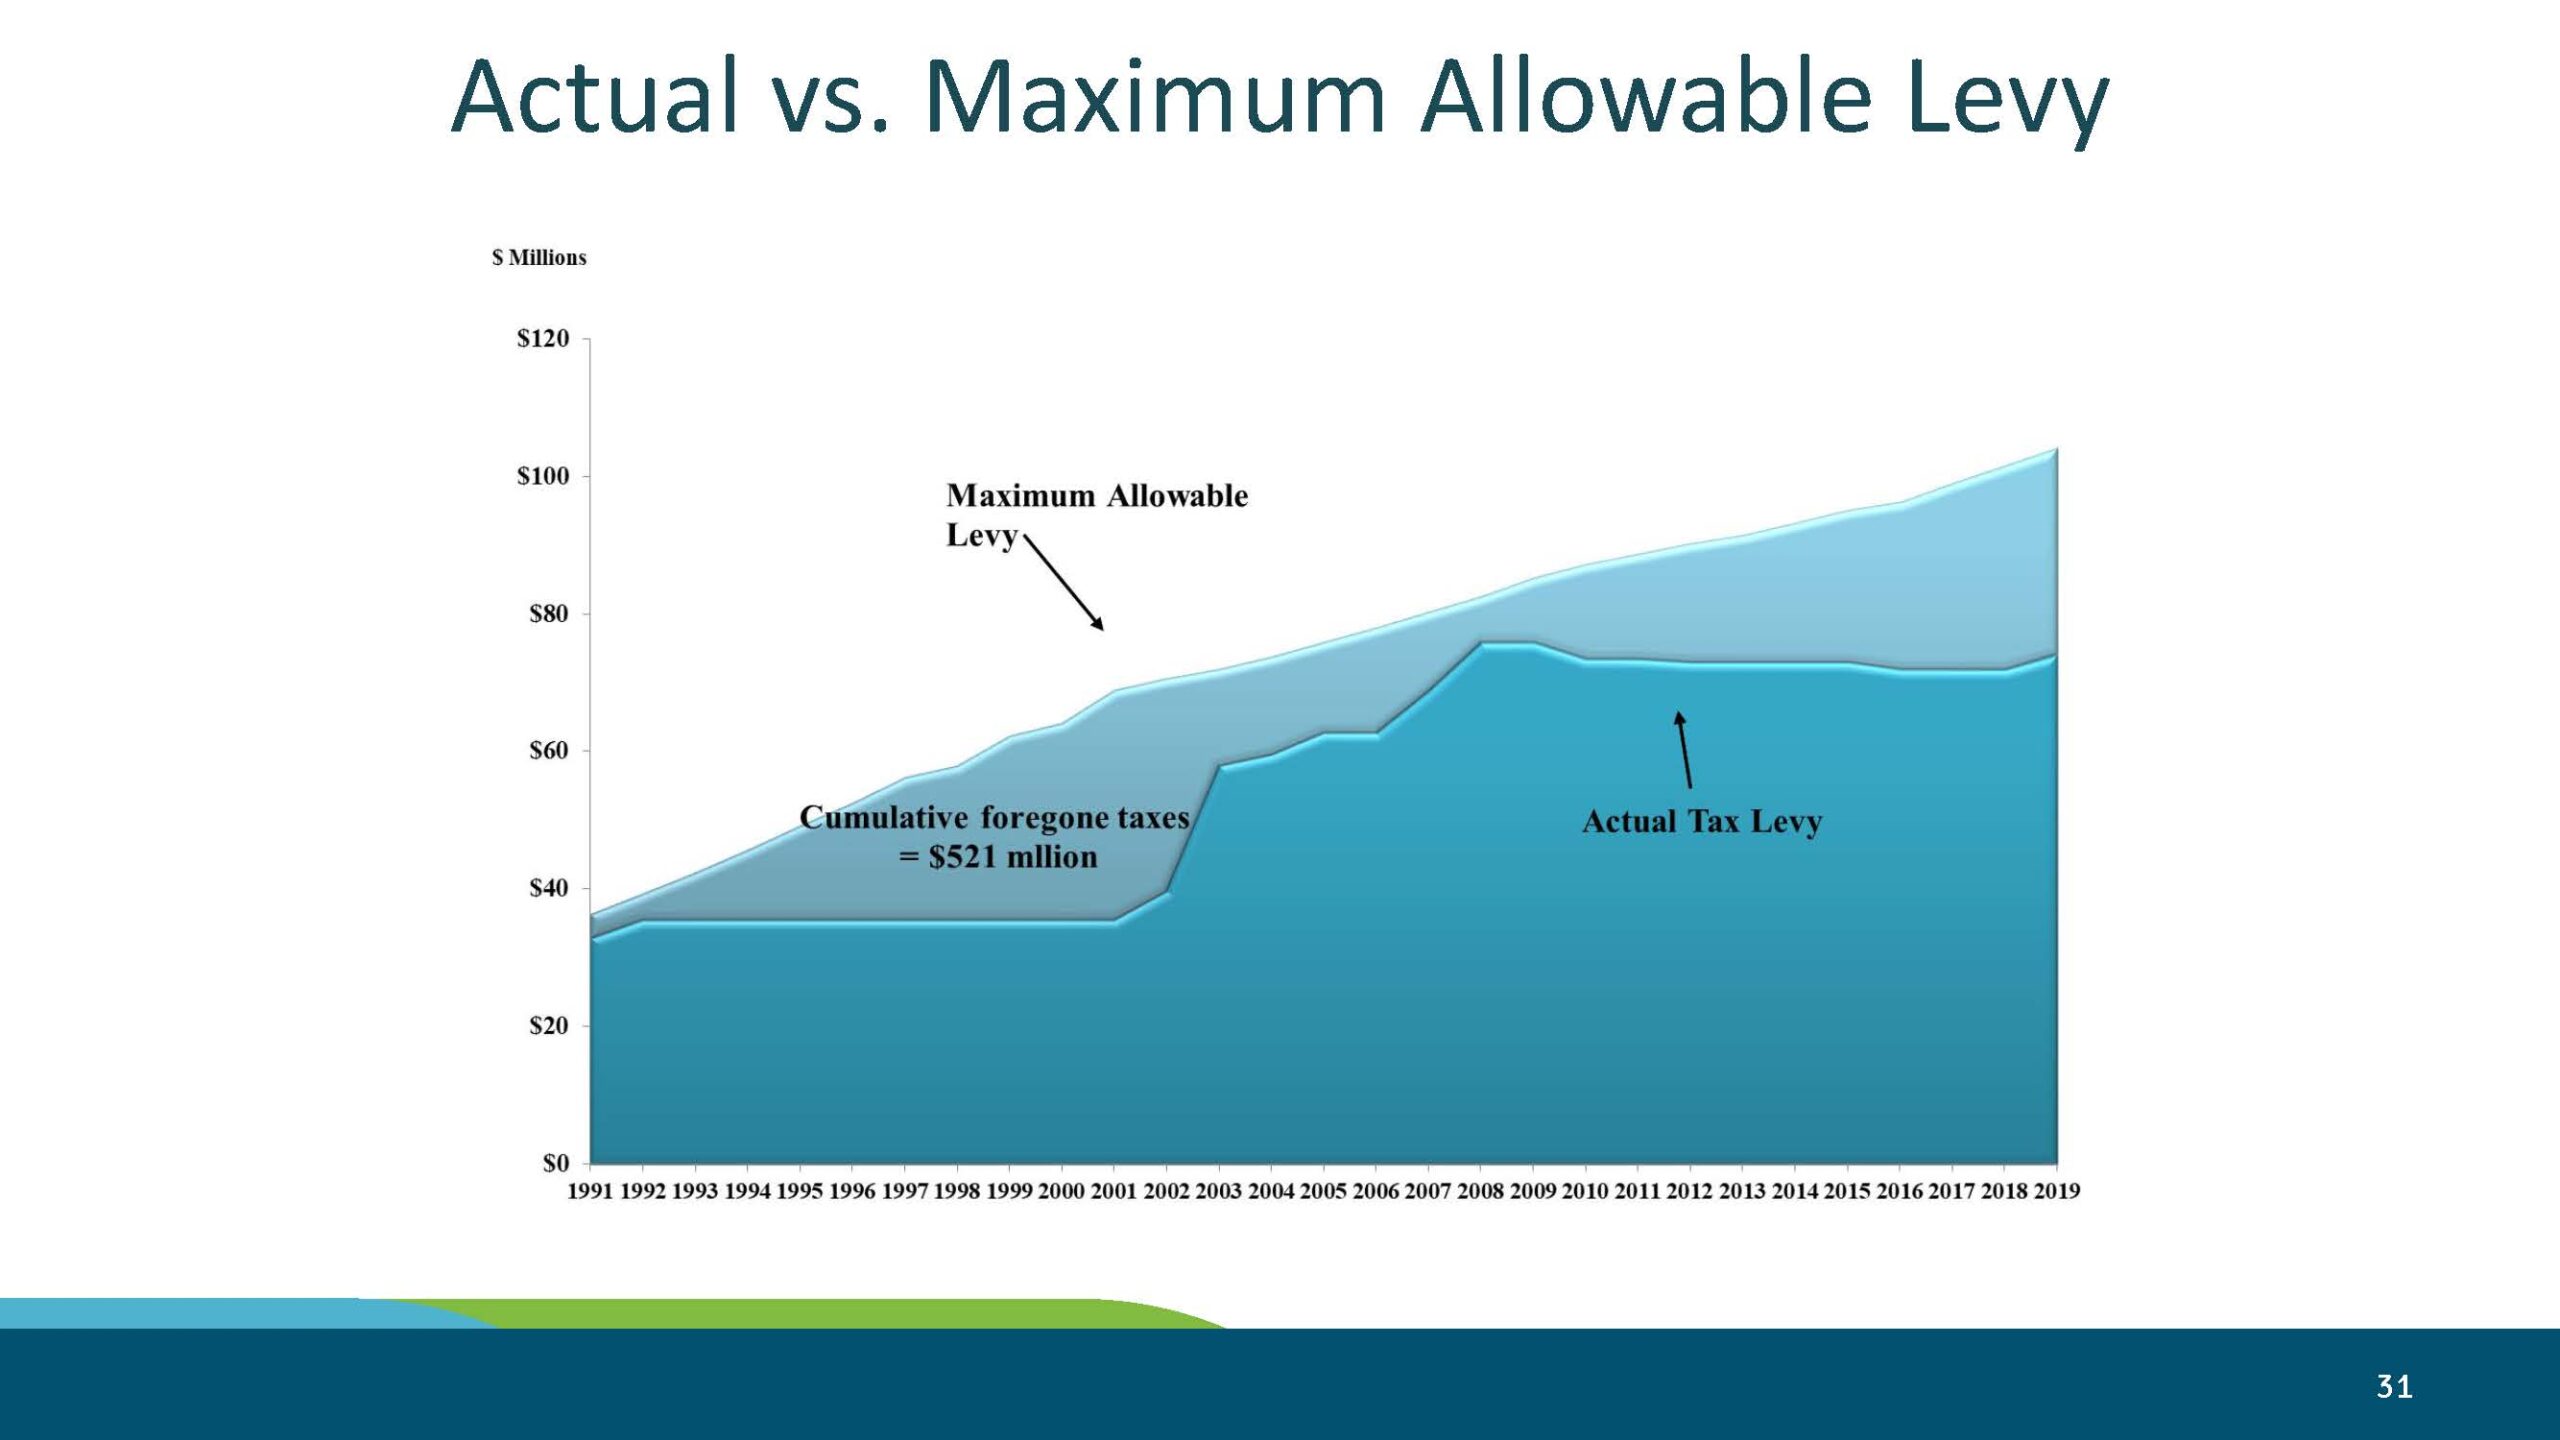
Area chart comparing the Maximum Allowable Levy to the Actual Tax Levy in millions of dollars from 1991 to 2019, with the gap between the two lines representing cumulative foregone taxes totaling $521 million. The actual levy remained consistently below the maximum allowable levy throughout the period shown.Open full document
Notes
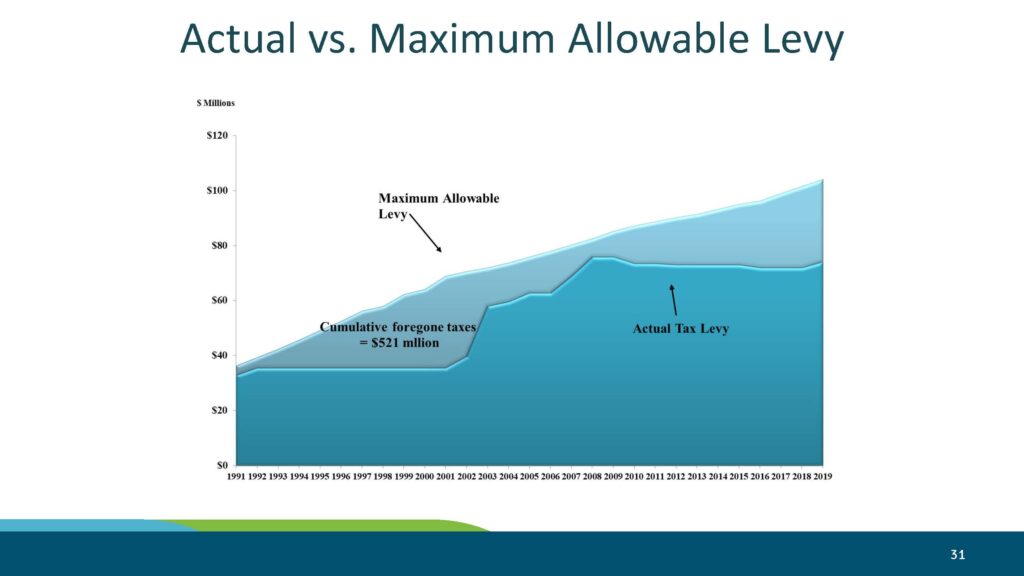
Area chart comparing the Maximum Allowable Levy to the Actual Tax Levy in millions of dollars from 1991 to 2019, with the gap between the two lines representing cumulative foregone taxes totaling $521 million. The actual levy remained consistently below the maximum allowable levy throughout the period shown.