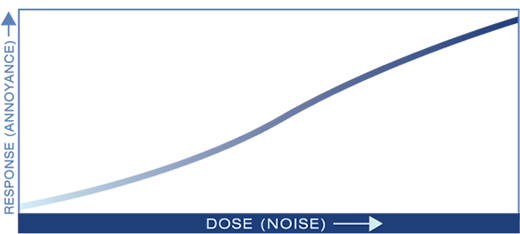
A scientific diagram showing a sigmoid-shaped dose-response curve with 'Dose (Noise)' on the horizontal axis and 'Response (Annoyance)' on the vertical axis. The curve illustrates the nonlinear relationship between noise exposure levels and human annoyance response, a concept commonly used in environmental noise policy and airport noise impact studies.Open full document
Notes
A scientific diagram showing a sigmoid-shaped dose-response curve with ‘Dose (Noise)’ on the horizontal axis and ‘Response (Annoyance)’ on the vertical axis. The curve illustrates the nonlinear relationship between noise exposure levels and human annoyance response, a concept commonly used in environmental noise policy and airport noise impact studies.