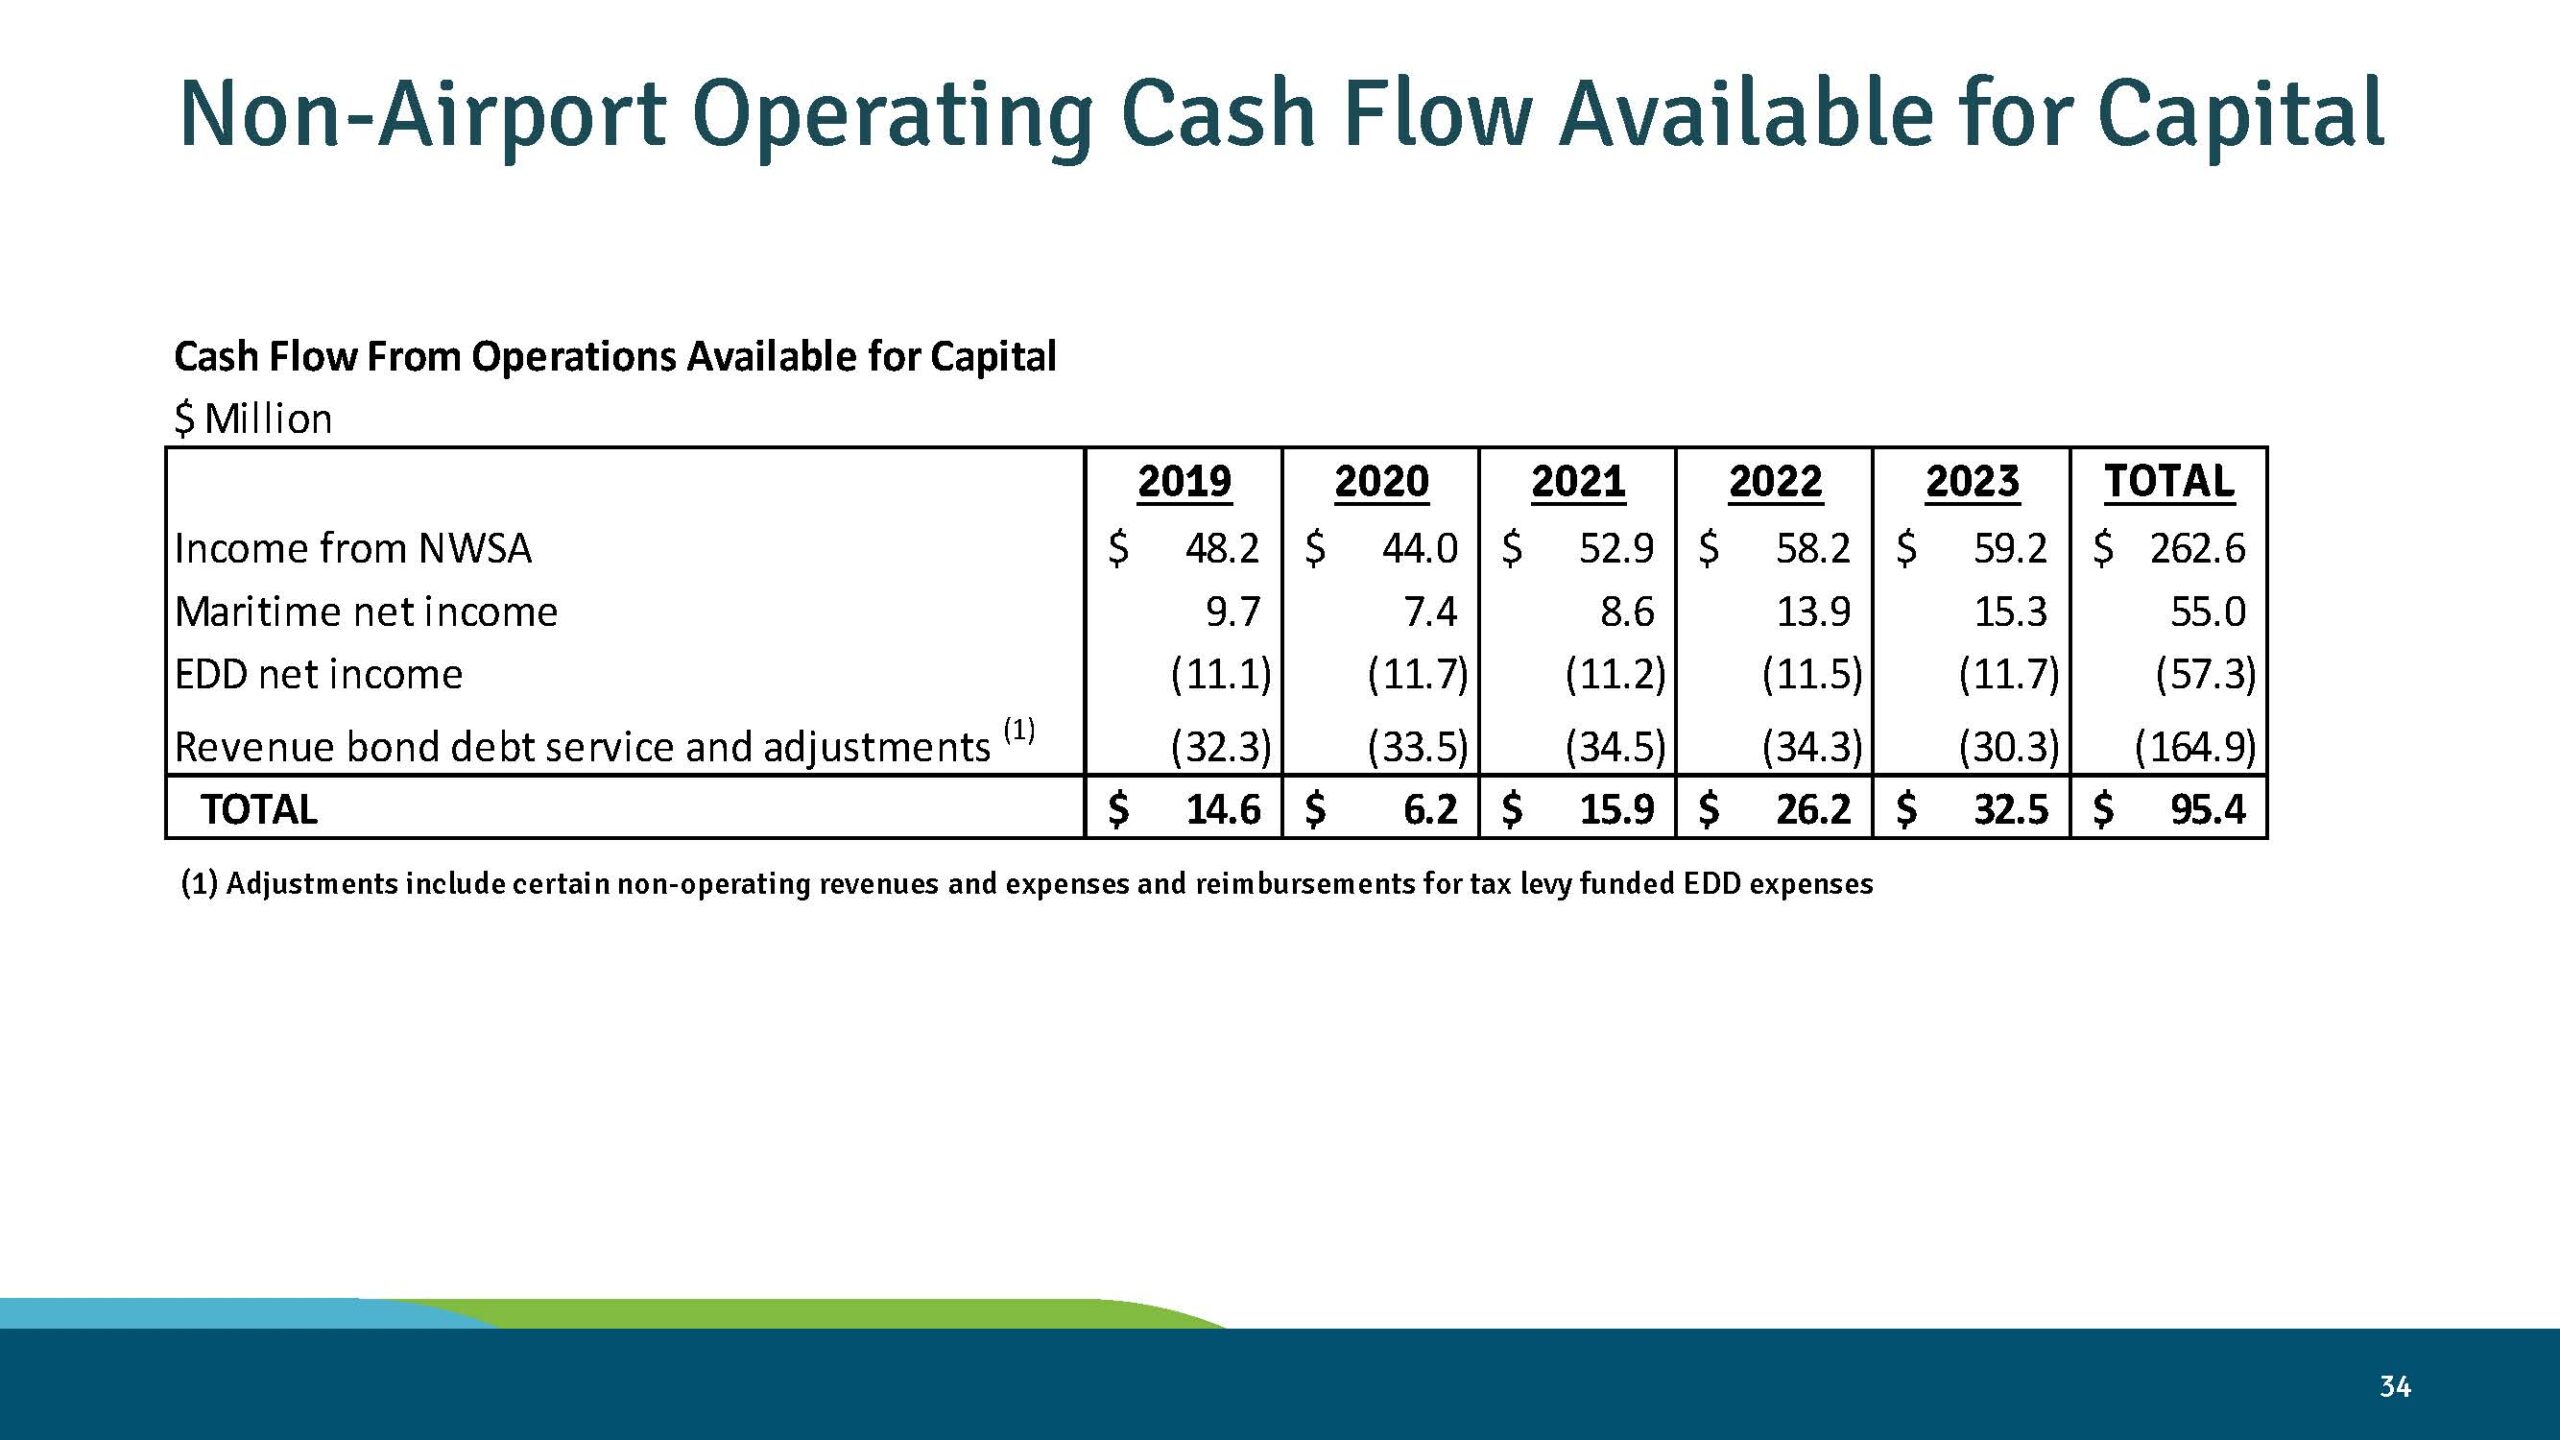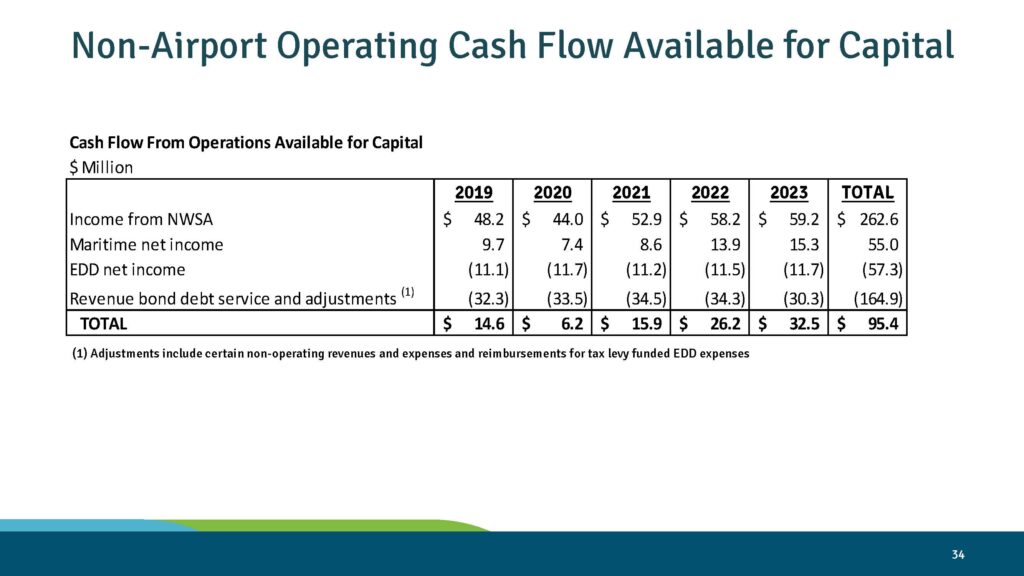
This financial table from a Port of Seattle presentation details Cash Flow From Operations Available for Capital across 2019–2023, broken down by Income from NWSA, Maritime net income, EDD net income, and Revenue bond debt service and adjustments. The five-year total cash flow available for capital is $95.4 million, with annual figures ranging from $6.2 million (2020) to $32.5 million (2023).Open full document
Notes
This financial table from a Port of Seattle presentation details Cash Flow From Operations Available for Capital across 2019–2023, broken down by Income from NWSA, Maritime net income, EDD net income, and Revenue bond debt service and adjustments. The five-year total cash flow available for capital is $95.4 million, with annual figures ranging from $6.2 million (2020) to $32.5 million (2023).