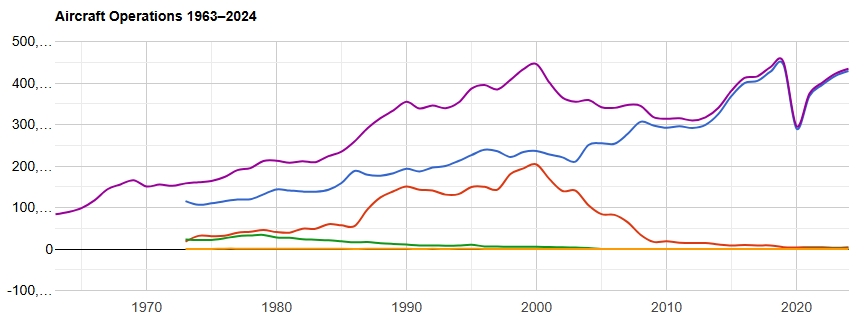
Line graph showing aircraft operations at Sea-Tac Airport from 1963 to 2024, with multiple trend lines tracking different operation categories. The chart shows a notable sharp dip around 2020, consistent with COVID-19 pandemic impacts on aviation, followed by recovery toward 400,000+ operations by 2024.Open full document
Notes
Line graph showing aircraft operations at Sea-Tac Airport from 1963 to 2024, with multiple trend lines tracking different operation categories. The chart shows a notable sharp dip around 2020, consistent with COVID-19 pandemic impacts on aviation, followed by recovery toward 400,000+ operations by 2024.