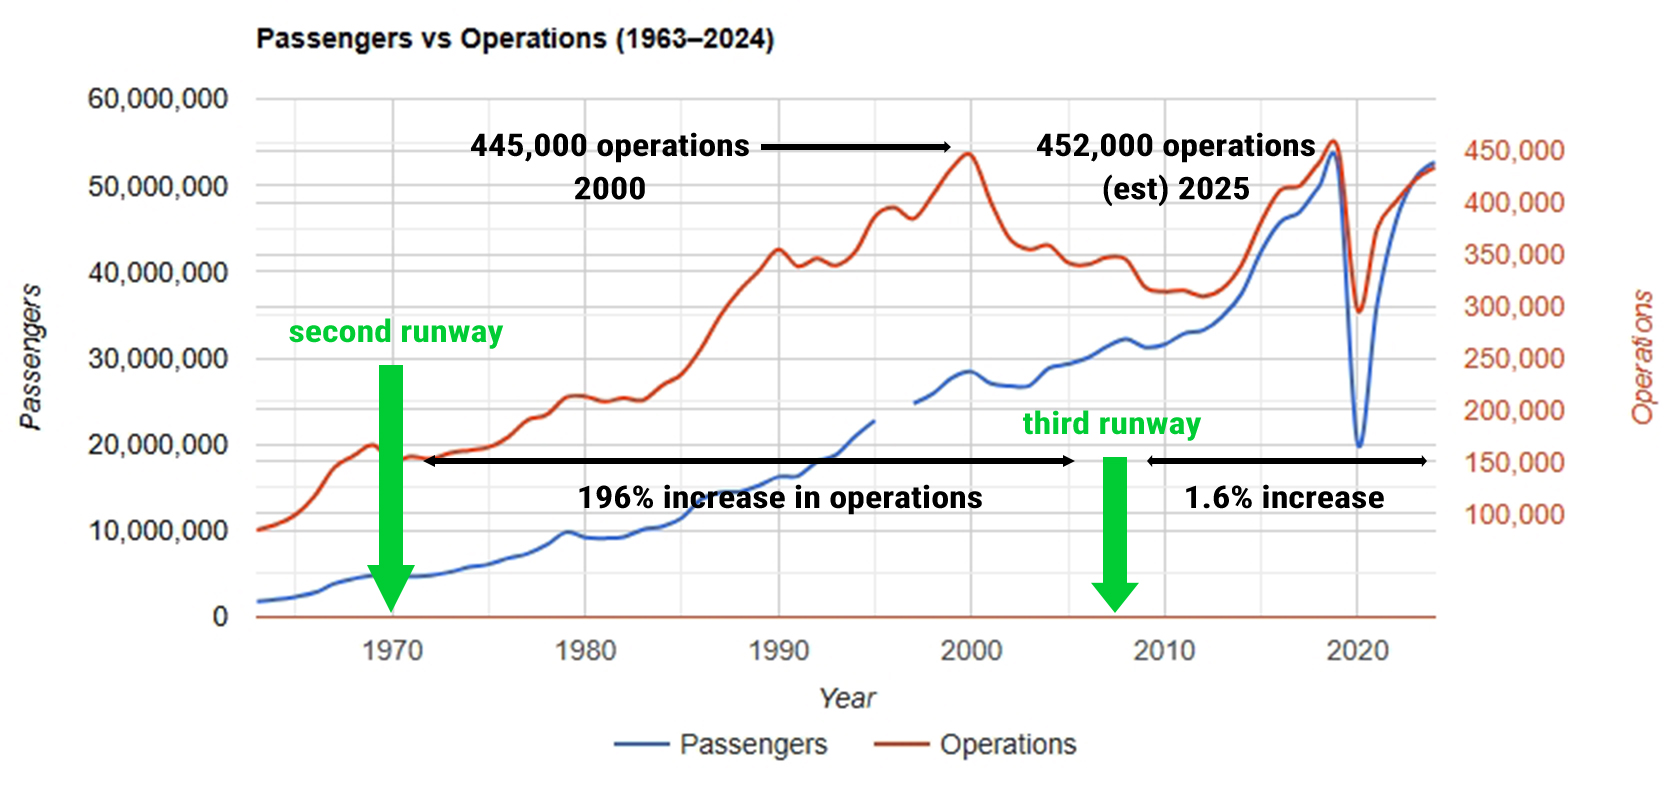
This chart compares passenger volumes and aircraft operations at Seattle-Tacoma International Airport from 1963 to 2024, highlighting the opening of the second runway (~1970) and third runway (~2008). Key annotations show a 196% increase in operations between those runway openings, a peak of 445,000 operations in 2000, and an estimated 452,000 operations in 2025—only a 1.6% increase over the post-COVID recovery period.Open full document
Notes
This chart compares passenger volumes and aircraft operations at Seattle-Tacoma International Airport from 1963 to 2024, highlighting the opening of the second runway (~1970) and third runway (~2008). Key annotations show a 196% increase in operations between those runway openings, a peak of 445,000 operations in 2000, and an estimated 452,000 operations in 2025—only a 1.6% increase over the post-COVID recovery period.