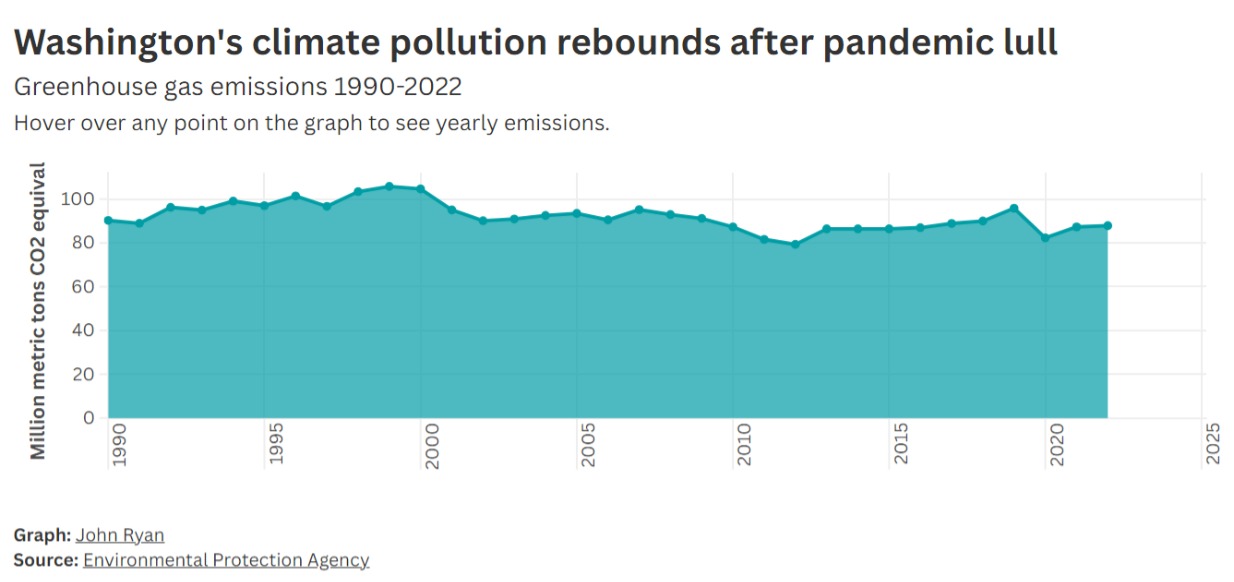
A line/area chart from the Environmental Protection Agency, graphed by John Ryan, showing Washington State greenhouse gas emissions in million metric tons CO2 equivalent from 1990 to 2022. The chart notes that climate pollution rebounded after a pandemic-era dip around 2020, with emissions hovering near 85–90 million metric tons in 2022.Open full document
Notes
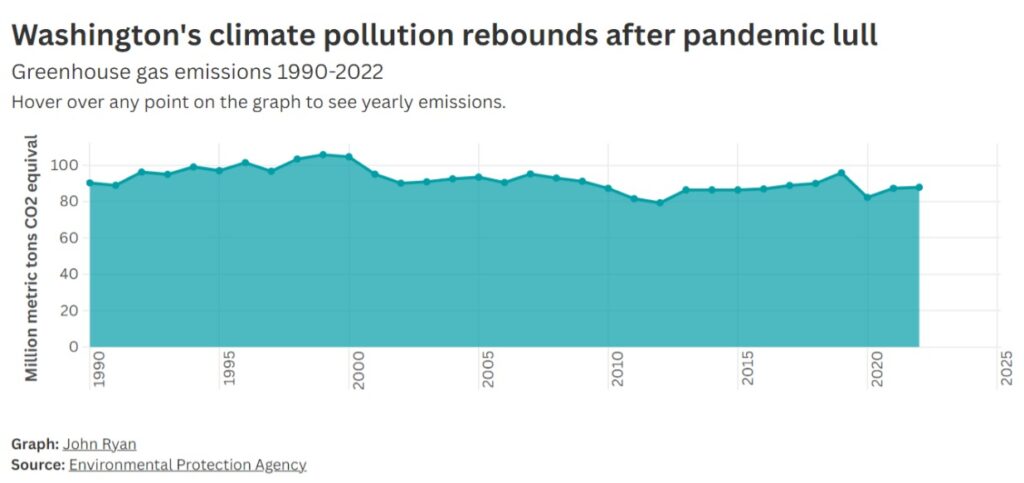
A line/area chart from the Environmental Protection Agency, graphed by John Ryan, showing Washington State greenhouse gas emissions in million metric tons CO2 equivalent from 1990 to 2022. The chart notes that climate pollution rebounded after a pandemic-era dip around 2020, with emissions hovering near 85–90 million metric tons in 2022.