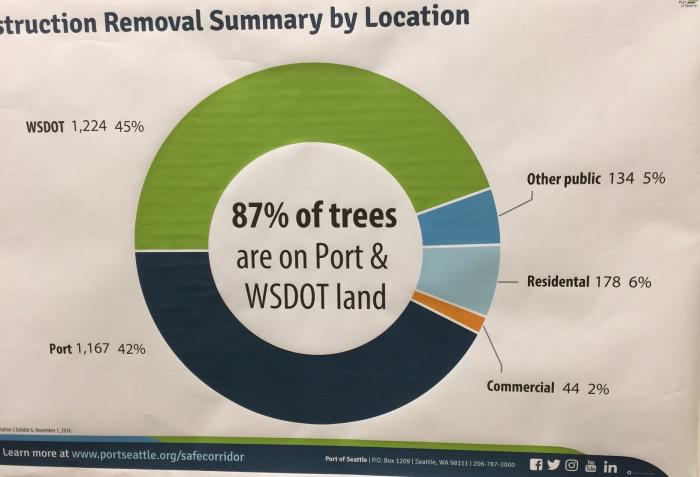
A donut chart titled 'Obstruction Removal Summary by Location' from the Port of Seattle, dated November 1, 2016, showing that 87% of trees slated for removal are on Port (1,167 trees, 42%) and WSDOT (1,224 trees, 45%) land, with smaller shares on Other Public (134, 5%), Residential (178, 6%), and Commercial (44, 2%) properties. The document references www.portseattle.org/safecorridor.Open full document
Notes
A donut chart titled ‘Obstruction Removal Summary by Location’ from the Port of Seattle, dated November 1, 2016, showing that 87% of trees slated for removal are on Port (1,167 trees, 42%) and WSDOT (1,224 trees, 45%) land, with smaller shares on Other Public (134, 5%), Residential (178, 6%), and Commercial (44, 2%) properties. The document references www.portseattle.org/safecorridor.