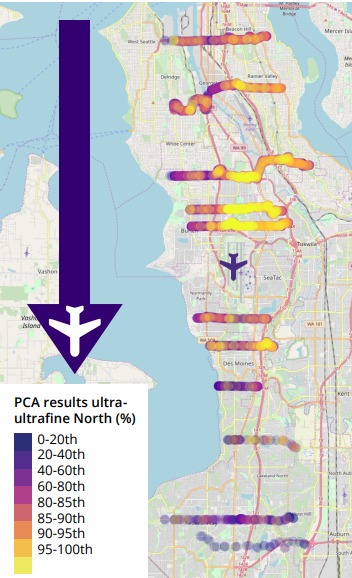
A GIS heatmap overlay on a Seattle/Sea-Tac area street map showing PCA results for ultra-ultrafine particle concentrations (percentile ranges 0–100th) along northbound flight corridors, with a large arrow and airplane icon indicating the northbound approach direction. The legend labels the data 'PCA results ultra-ultrafine North (%)' with a color scale from dark purple (0–20th percentile) to yellow (95–100th percentile), indicating highest concentrations beneath flight paths north of Seattle-Tacoma International Airport.Open full document
Notes
A GIS heatmap overlay on a Seattle/Sea-Tac area street map showing PCA results for ultra-ultrafine particle concentrations (percentile ranges 0–100th) along northbound flight corridors, with a large arrow and airplane icon indicating the northbound approach direction. The legend labels the data ‘PCA results ultra-ultrafine North (%)’ with a color scale from dark purple (0–20th percentile) to yellow (95–100th percentile), indicating highest concentrations beneath flight paths north of Seattle-Tacoma International Airport.