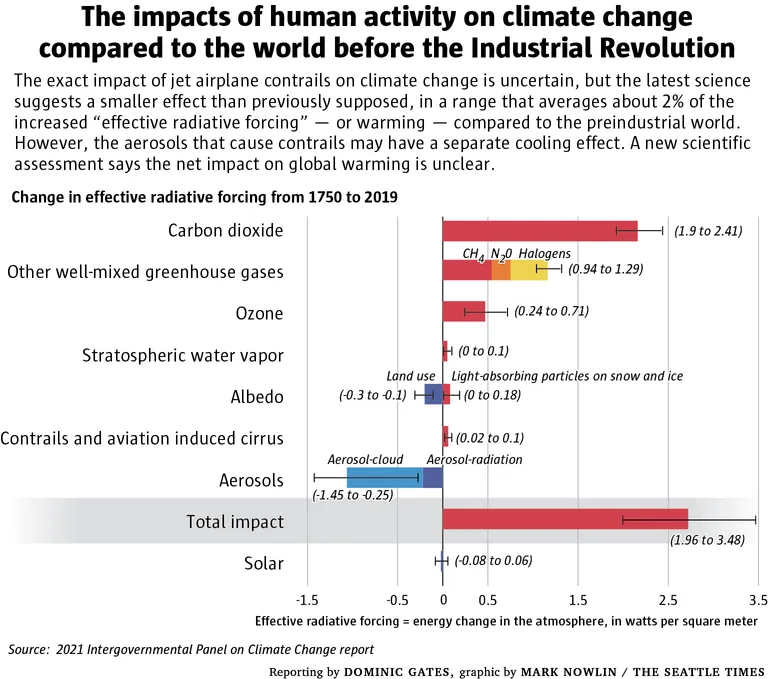
A Seattle Times infographic by Mark Nowlin, reporting by Dominic Gates, illustrating the change in effective radiative forcing from 1750 to 2019 based on the 2021 Intergovernmental Panel on Climate Change (IPCC) report. The chart shows carbon dioxide as the largest warming contributor (1.9 to 2.41 W/m²), with aerosols providing the greatest cooling effect (-1.45 to -0.25 W/m²), and a total human impact range of 1.96 to 3.48 W/m².Open full document
Notes
A Seattle Times infographic by Mark Nowlin, reporting by Dominic Gates, illustrating the change in effective radiative forcing from 1750 to 2019 based on the 2021 Intergovernmental Panel on Climate Change (IPCC) report. The chart shows carbon dioxide as the largest warming contributor (1.9 to 2.41 W/m²), with aerosols providing the greatest cooling effect (-1.45 to -0.25 W/m²), and a total human impact range of 1.96 to 3.48 W/m².