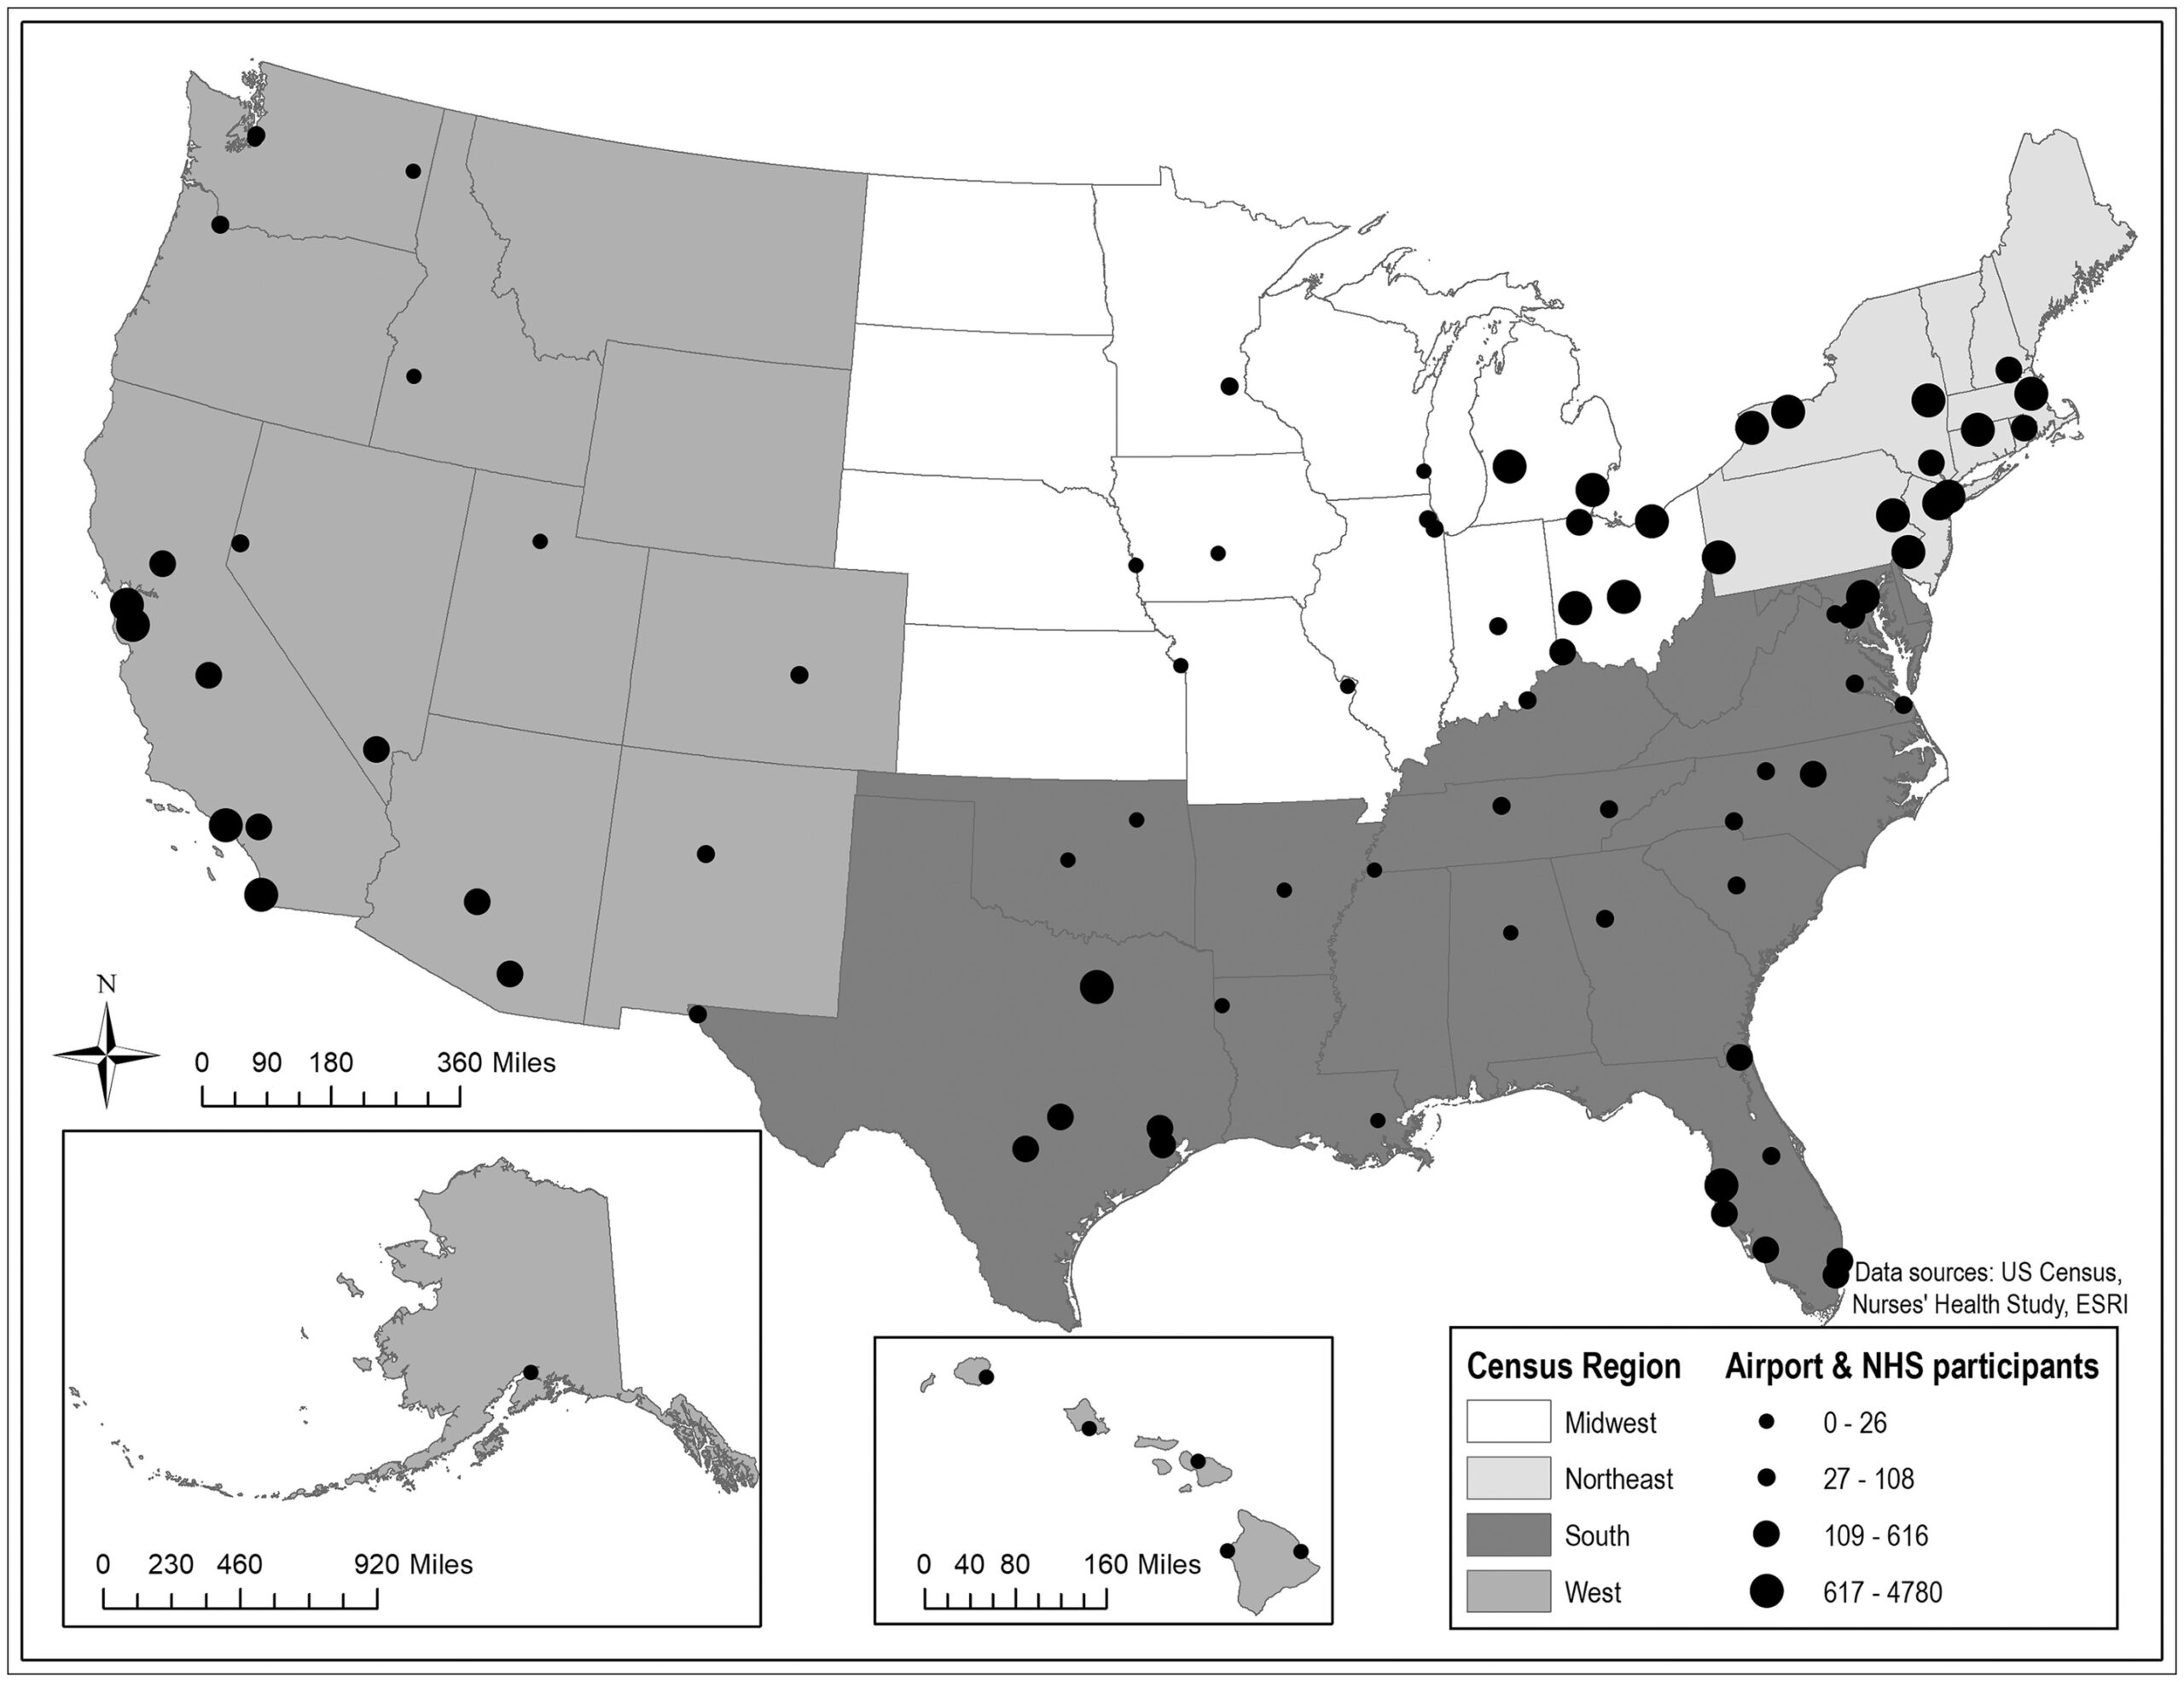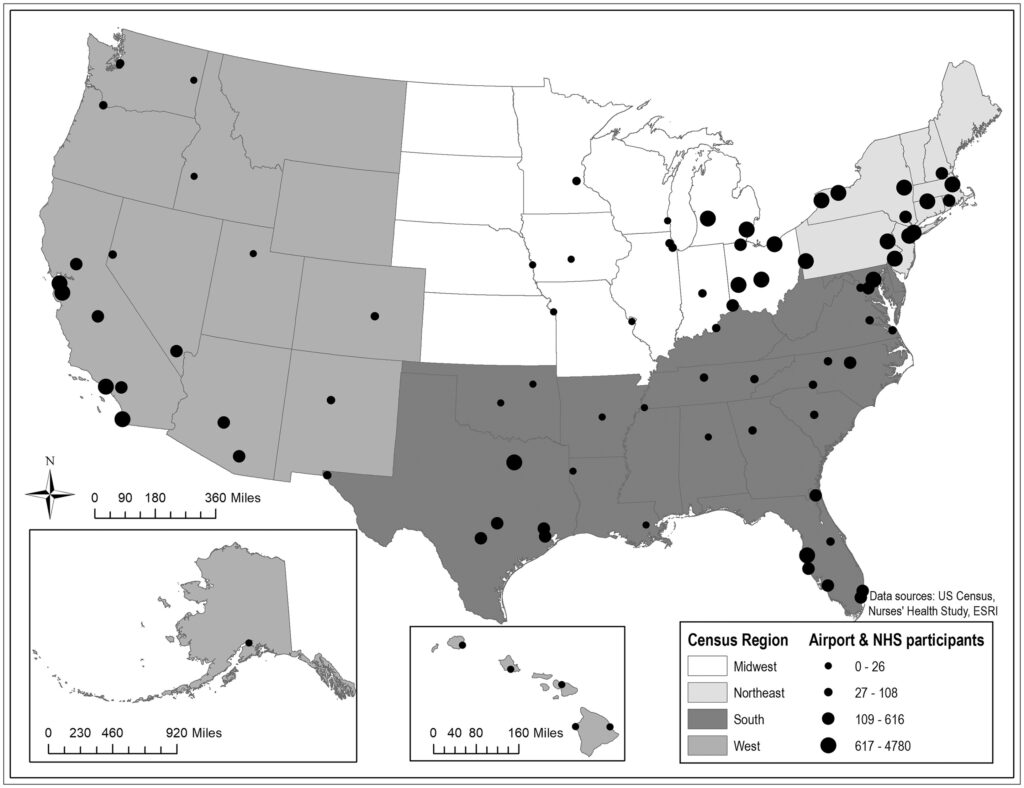
A proportional symbol map of the contiguous United States (plus Alaska and Hawaii insets) showing airports and Nurses' Health Study participant counts in four size categories (0–26, 27–108, 109–616, 617–4780), shaded by US Census region (Midwest, Northeast, South, West). Data sources are credited to the US Census, Nurses' Health Study, and ESRI; the largest participant concentrations appear in the Northeast corridor and around major metros including the Seattle/Tacoma area, consistent with Sea-Tac Airport noise research applications.Open full document
Notes
A proportional symbol map of the contiguous United States (plus Alaska and Hawaii insets) showing airports and Nurses’ Health Study participant counts in four size categories (0–26, 27–108, 109–616, 617–4780), shaded by US Census region (Midwest, Northeast, South, West). Data sources are credited to the US Census, Nurses’ Health Study, and ESRI; the largest participant concentrations appear in the Northeast corridor and around major metros including the Seattle/Tacoma area, consistent with Sea-Tac Airport noise research applications.