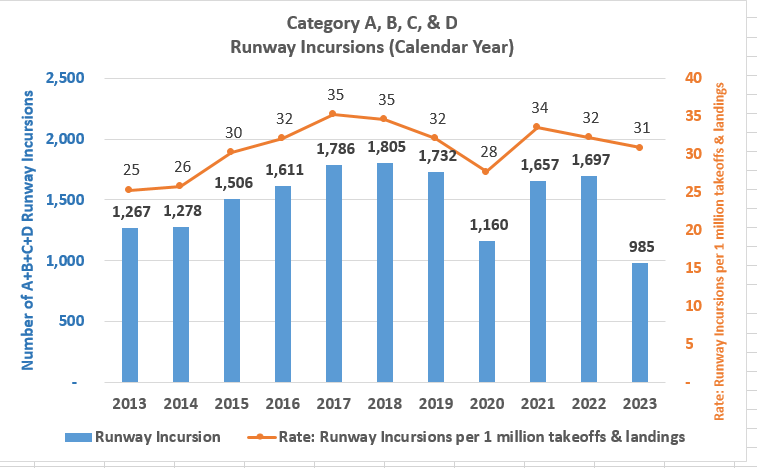
This FAA chart tracks the total number of Category A, B, C, and D runway incursions (blue bars, left axis) and their rate per million takeoffs and landings (orange line, right axis) from 2013 to 2023. Incursion counts peaked at 1,805 in 2018 and dropped to a decade low of 985 in 2023, while the rate peaked at 35 per million operations in 2017–2018.Open full document
Notes
This FAA chart tracks the total number of Category A, B, C, and D runway incursions (blue bars, left axis) and their rate per million takeoffs and landings (orange line, right axis) from 2013 to 2023. Incursion counts peaked at 1,805 in 2018 and dropped to a decade low of 985 in 2023, while the rate peaked at 35 per million operations in 2017–2018.