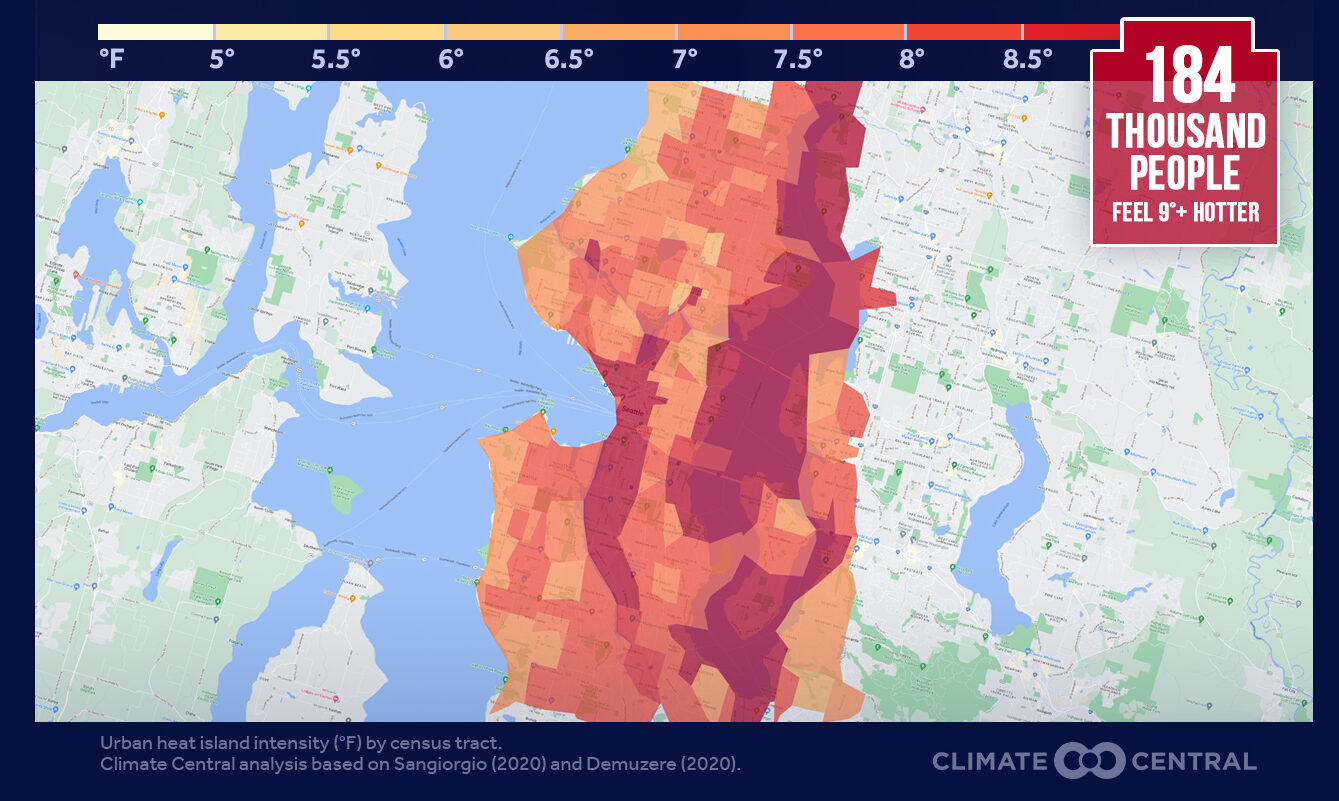
A Climate Central heat map showing urban heat island intensity (°F) by census tract in Seattle, Washington, based on Sangiorgio (2020) and Demuzere (2020) analyses. The map highlights that 184 thousand people in the Seattle area experience temperatures 9°F or more hotter than surrounding areas, with the densest urban core showing the highest heat intensity.Open full document
Notes
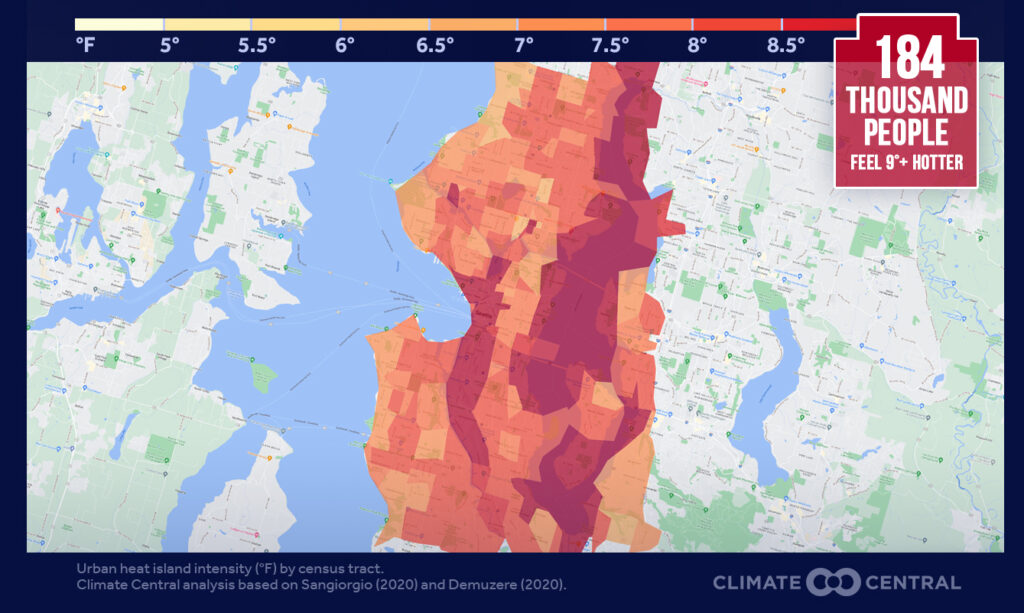
A Climate Central heat map showing urban heat island intensity (°F) by census tract in Seattle, Washington, based on Sangiorgio (2020) and Demuzere (2020) analyses. The map highlights that 184 thousand people in the Seattle area experience temperatures 9°F or more hotter than surrounding areas, with the densest urban core showing the highest heat intensity.