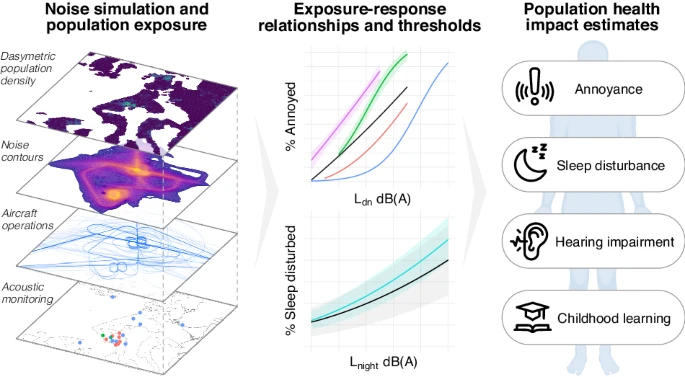
A three-panel scientific diagram illustrating a methodology for assessing population health impacts from aircraft noise, showing inputs of dasymetric population density, noise contours, aircraft operations, and acoustic monitoring on the left; exposure-response curves for annoyance (Ldn dB(A)) and sleep disturbance (Lnight dB(A)) in the center; and four health outcome categories on the right: annoyance, sleep disturbance, hearing impairment, and childhood learning. No specific organization, author, or publication is visibly identified in the image.Open full document
Notes
A three-panel scientific diagram illustrating a methodology for assessing population health impacts from aircraft noise, showing inputs of dasymetric population density, noise contours, aircraft operations, and acoustic monitoring on the left; exposure-response curves for annoyance (Ldn dB(A)) and sleep disturbance (Lnight dB(A)) in the center; and four health outcome categories on the right: annoyance, sleep disturbance, hearing impairment, and childhood learning. No specific organization, author, or publication is visibly identified in the image.