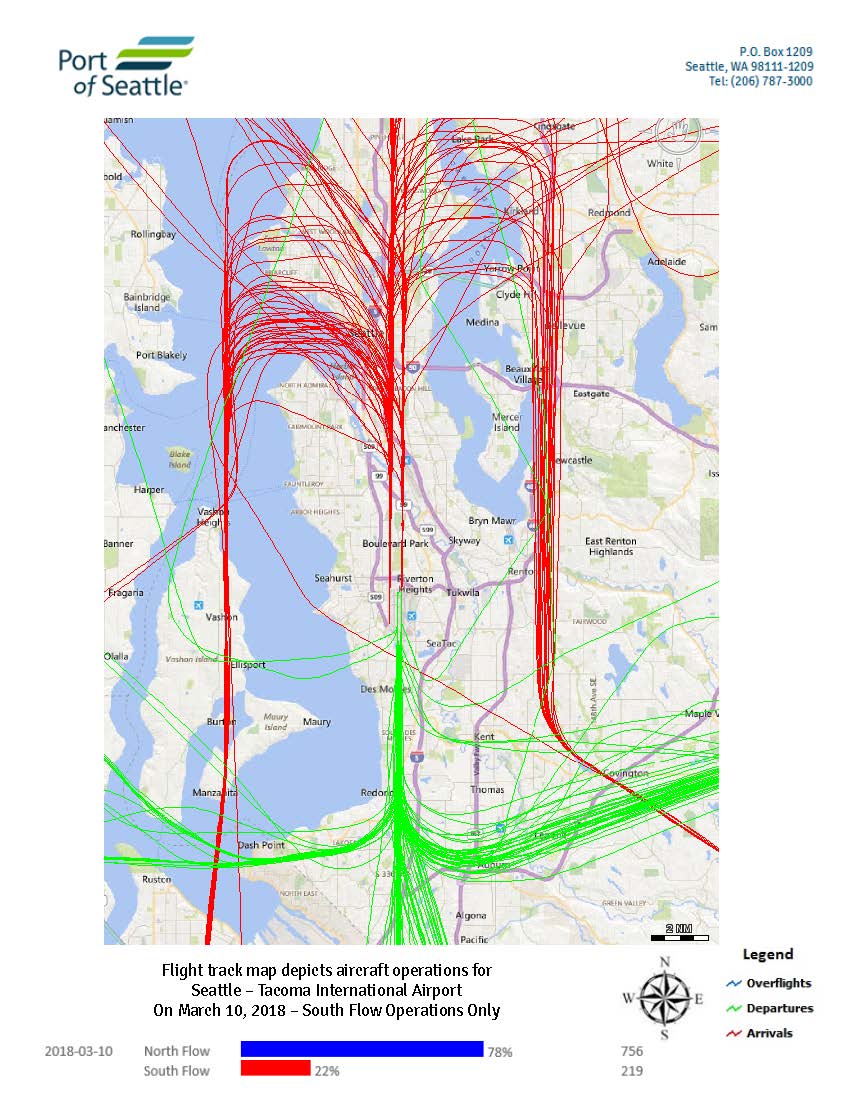
A Port of Seattle flight track map depicting aircraft operations at Seattle-Tacoma International Airport on March 10, 2018, showing South Flow operations only. The map displays arrival tracks in red and departure tracks in green, with a bar chart indicating North Flow accounted for 78% (756 operations) and South Flow 22% (219 operations) of total traffic that day.Open full document
Notes
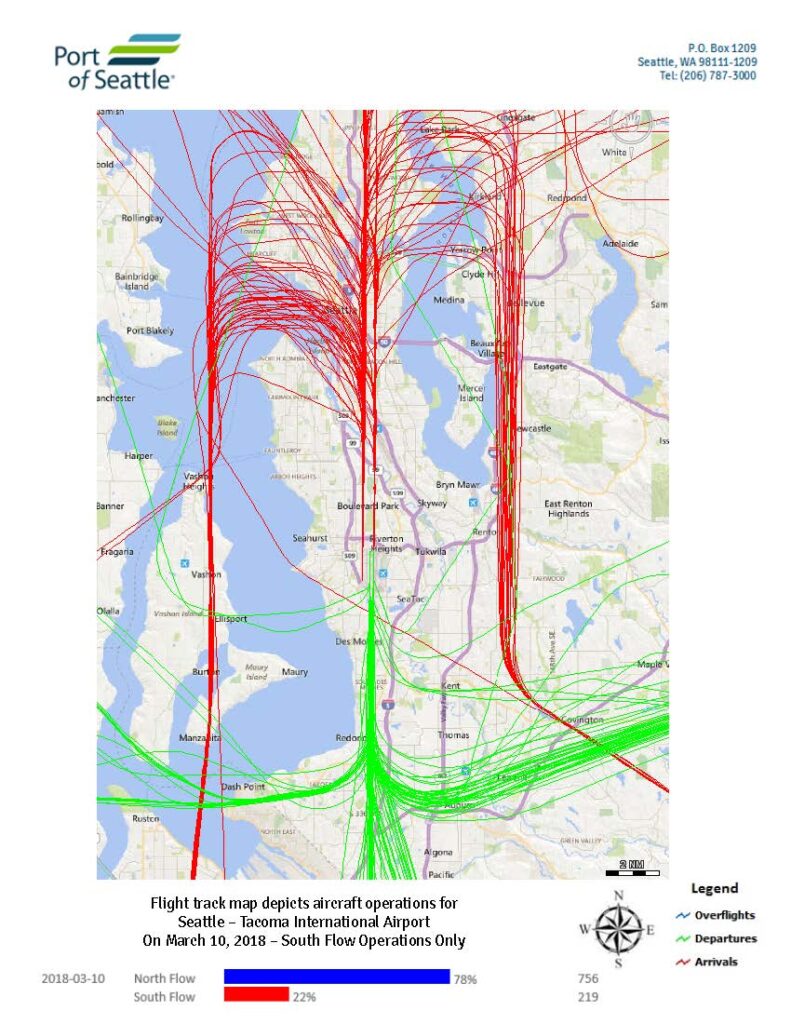
A Port of Seattle flight track map depicting aircraft operations at Seattle-Tacoma International Airport on March 10, 2018, showing South Flow operations only. The map displays arrival tracks in red and departure tracks in green, with a bar chart indicating North Flow accounted for 78% (756 operations) and South Flow 22% (219 operations) of total traffic that day.