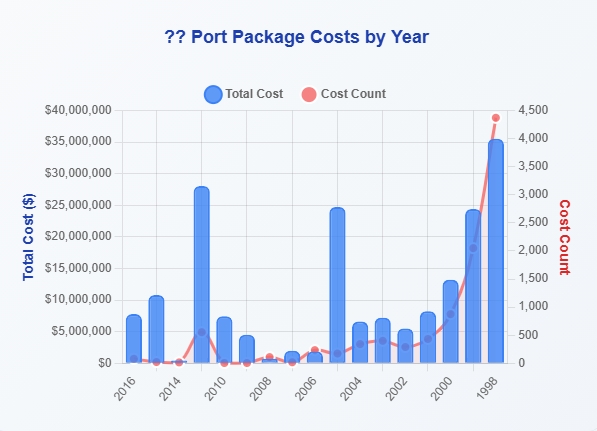
A dual-axis chart titled '?? Port Package Costs by Year' displaying Total Cost (blue bars, left axis in dollars) and Cost Count (red dots, right axis) from approximately 1998 to 2016. The title's leading text is partially obscured ('??'), preventing identification of the specific port or program name, but the data shows a sharp spike in both cost count and total cost around 1998–1999.Open full document
Notes
A dual-axis chart titled ‘?? Port Package Costs by Year’ displaying Total Cost (blue bars, left axis in dollars) and Cost Count (red dots, right axis) from approximately 1998 to 2016. The title’s leading text is partially obscured (‘??’), preventing identification of the specific port or program name, but the data shows a sharp spike in both cost count and total cost around 1998–1999.