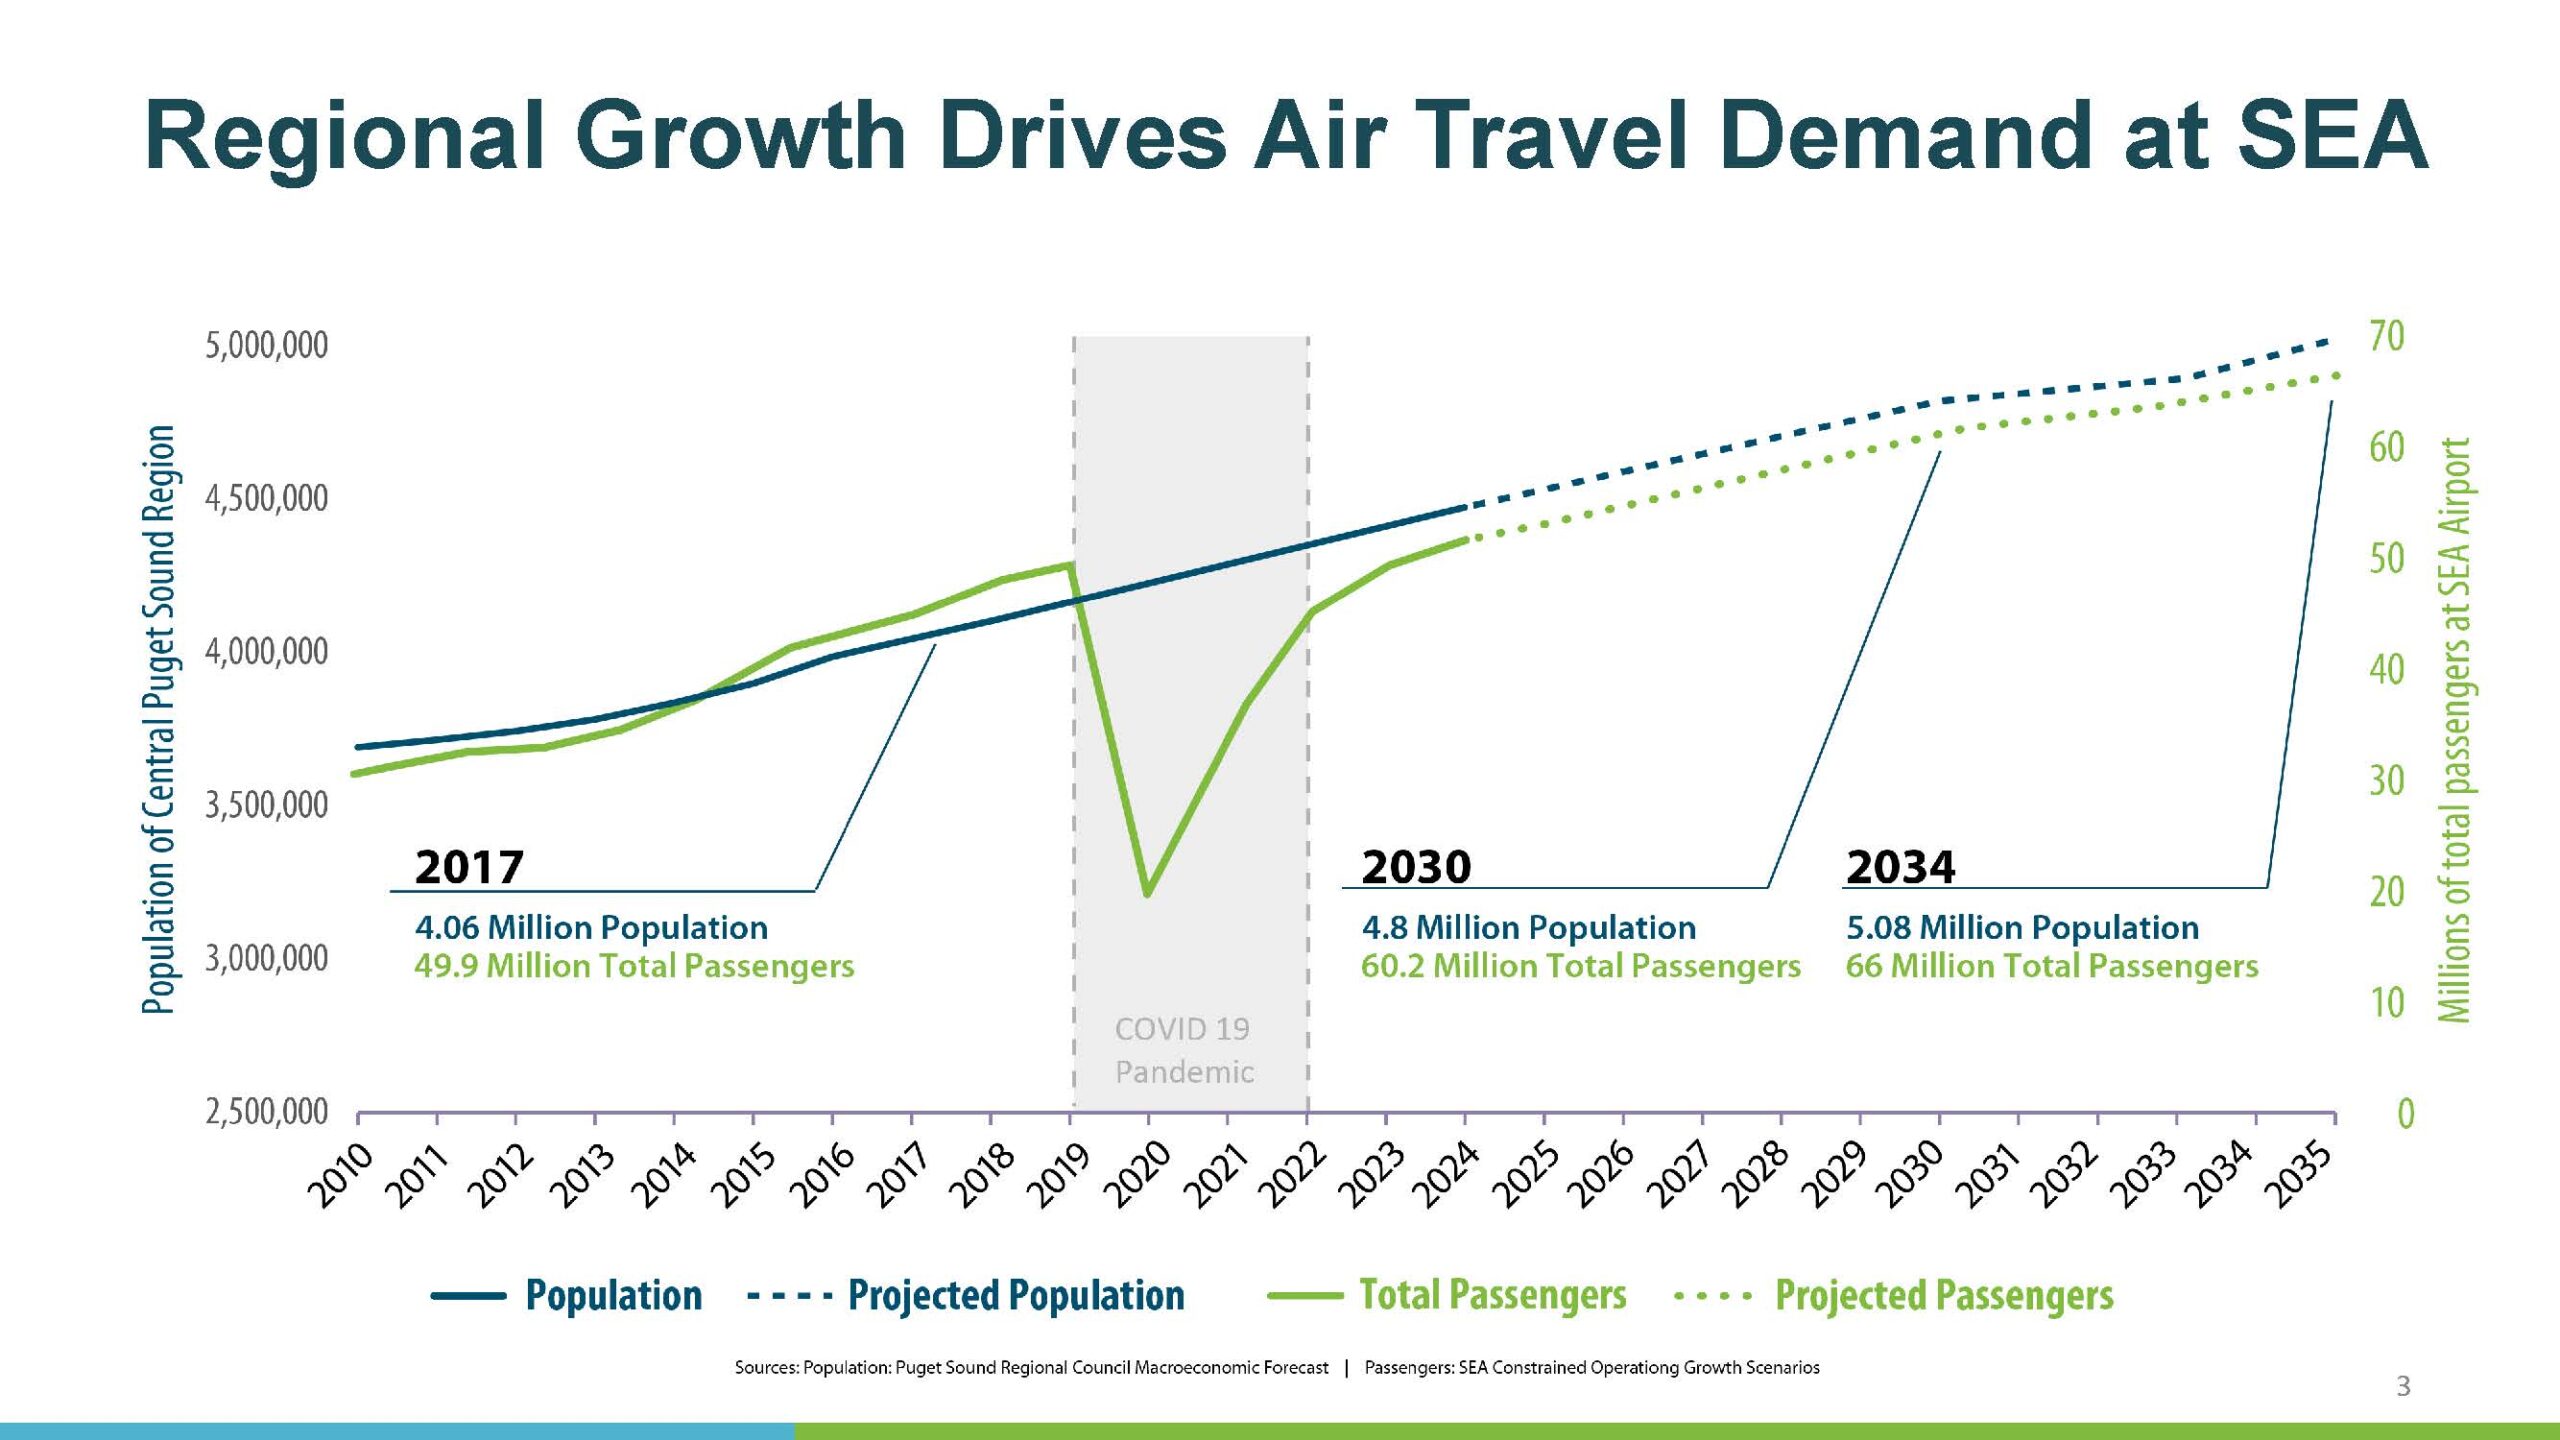
A slide titled 'Regional Growth Drives Air Travel Demand at SEA' presents a dual-axis line chart comparing Central Puget Sound Region population growth with total passenger volumes at Seattle-Tacoma International Airport (SEA) from 2010 through projected 2035. Key data points include 49.9 million passengers and 4.06 million population in 2017, 60.2 million passengers and 4.8 million population projected for 2030, and 66 million passengers and 5.08 million population projected for 2034, with a visible COVID-19 pandemic dip marked for 2019–2022. Sources cited are the Puget Sound Regional Council Macroeconomic Forecast and SEA Constrained Operating Growth Scenarios.Open full document
Notes
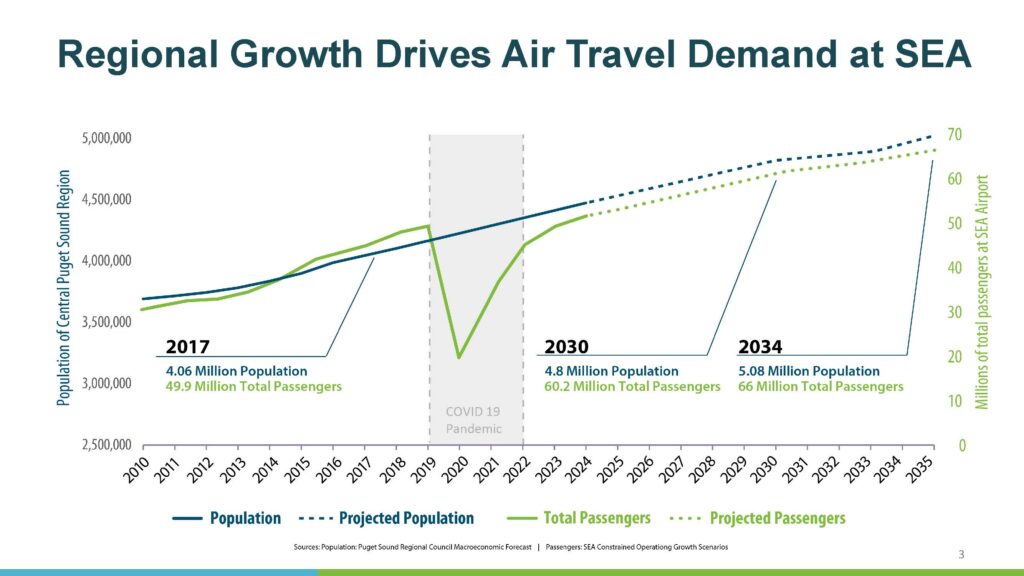
A slide titled ‘Regional Growth Drives Air Travel Demand at SEA’ presents a dual-axis line chart comparing Central Puget Sound Region population growth with total passenger volumes at Seattle-Tacoma International Airport (SEA) from 2010 through projected 2035. Key data points include 49.9 million passengers and 4.06 million population in 2017, 60.2 million passengers and 4.8 million population projected for 2030, and 66 million passengers and 5.08 million population projected for 2034, with a visible COVID-19 pandemic dip marked for 2019–2022. Sources cited are the Puget Sound Regional Council Macroeconomic Forecast and SEA Constrained Operating Growth Scenarios.