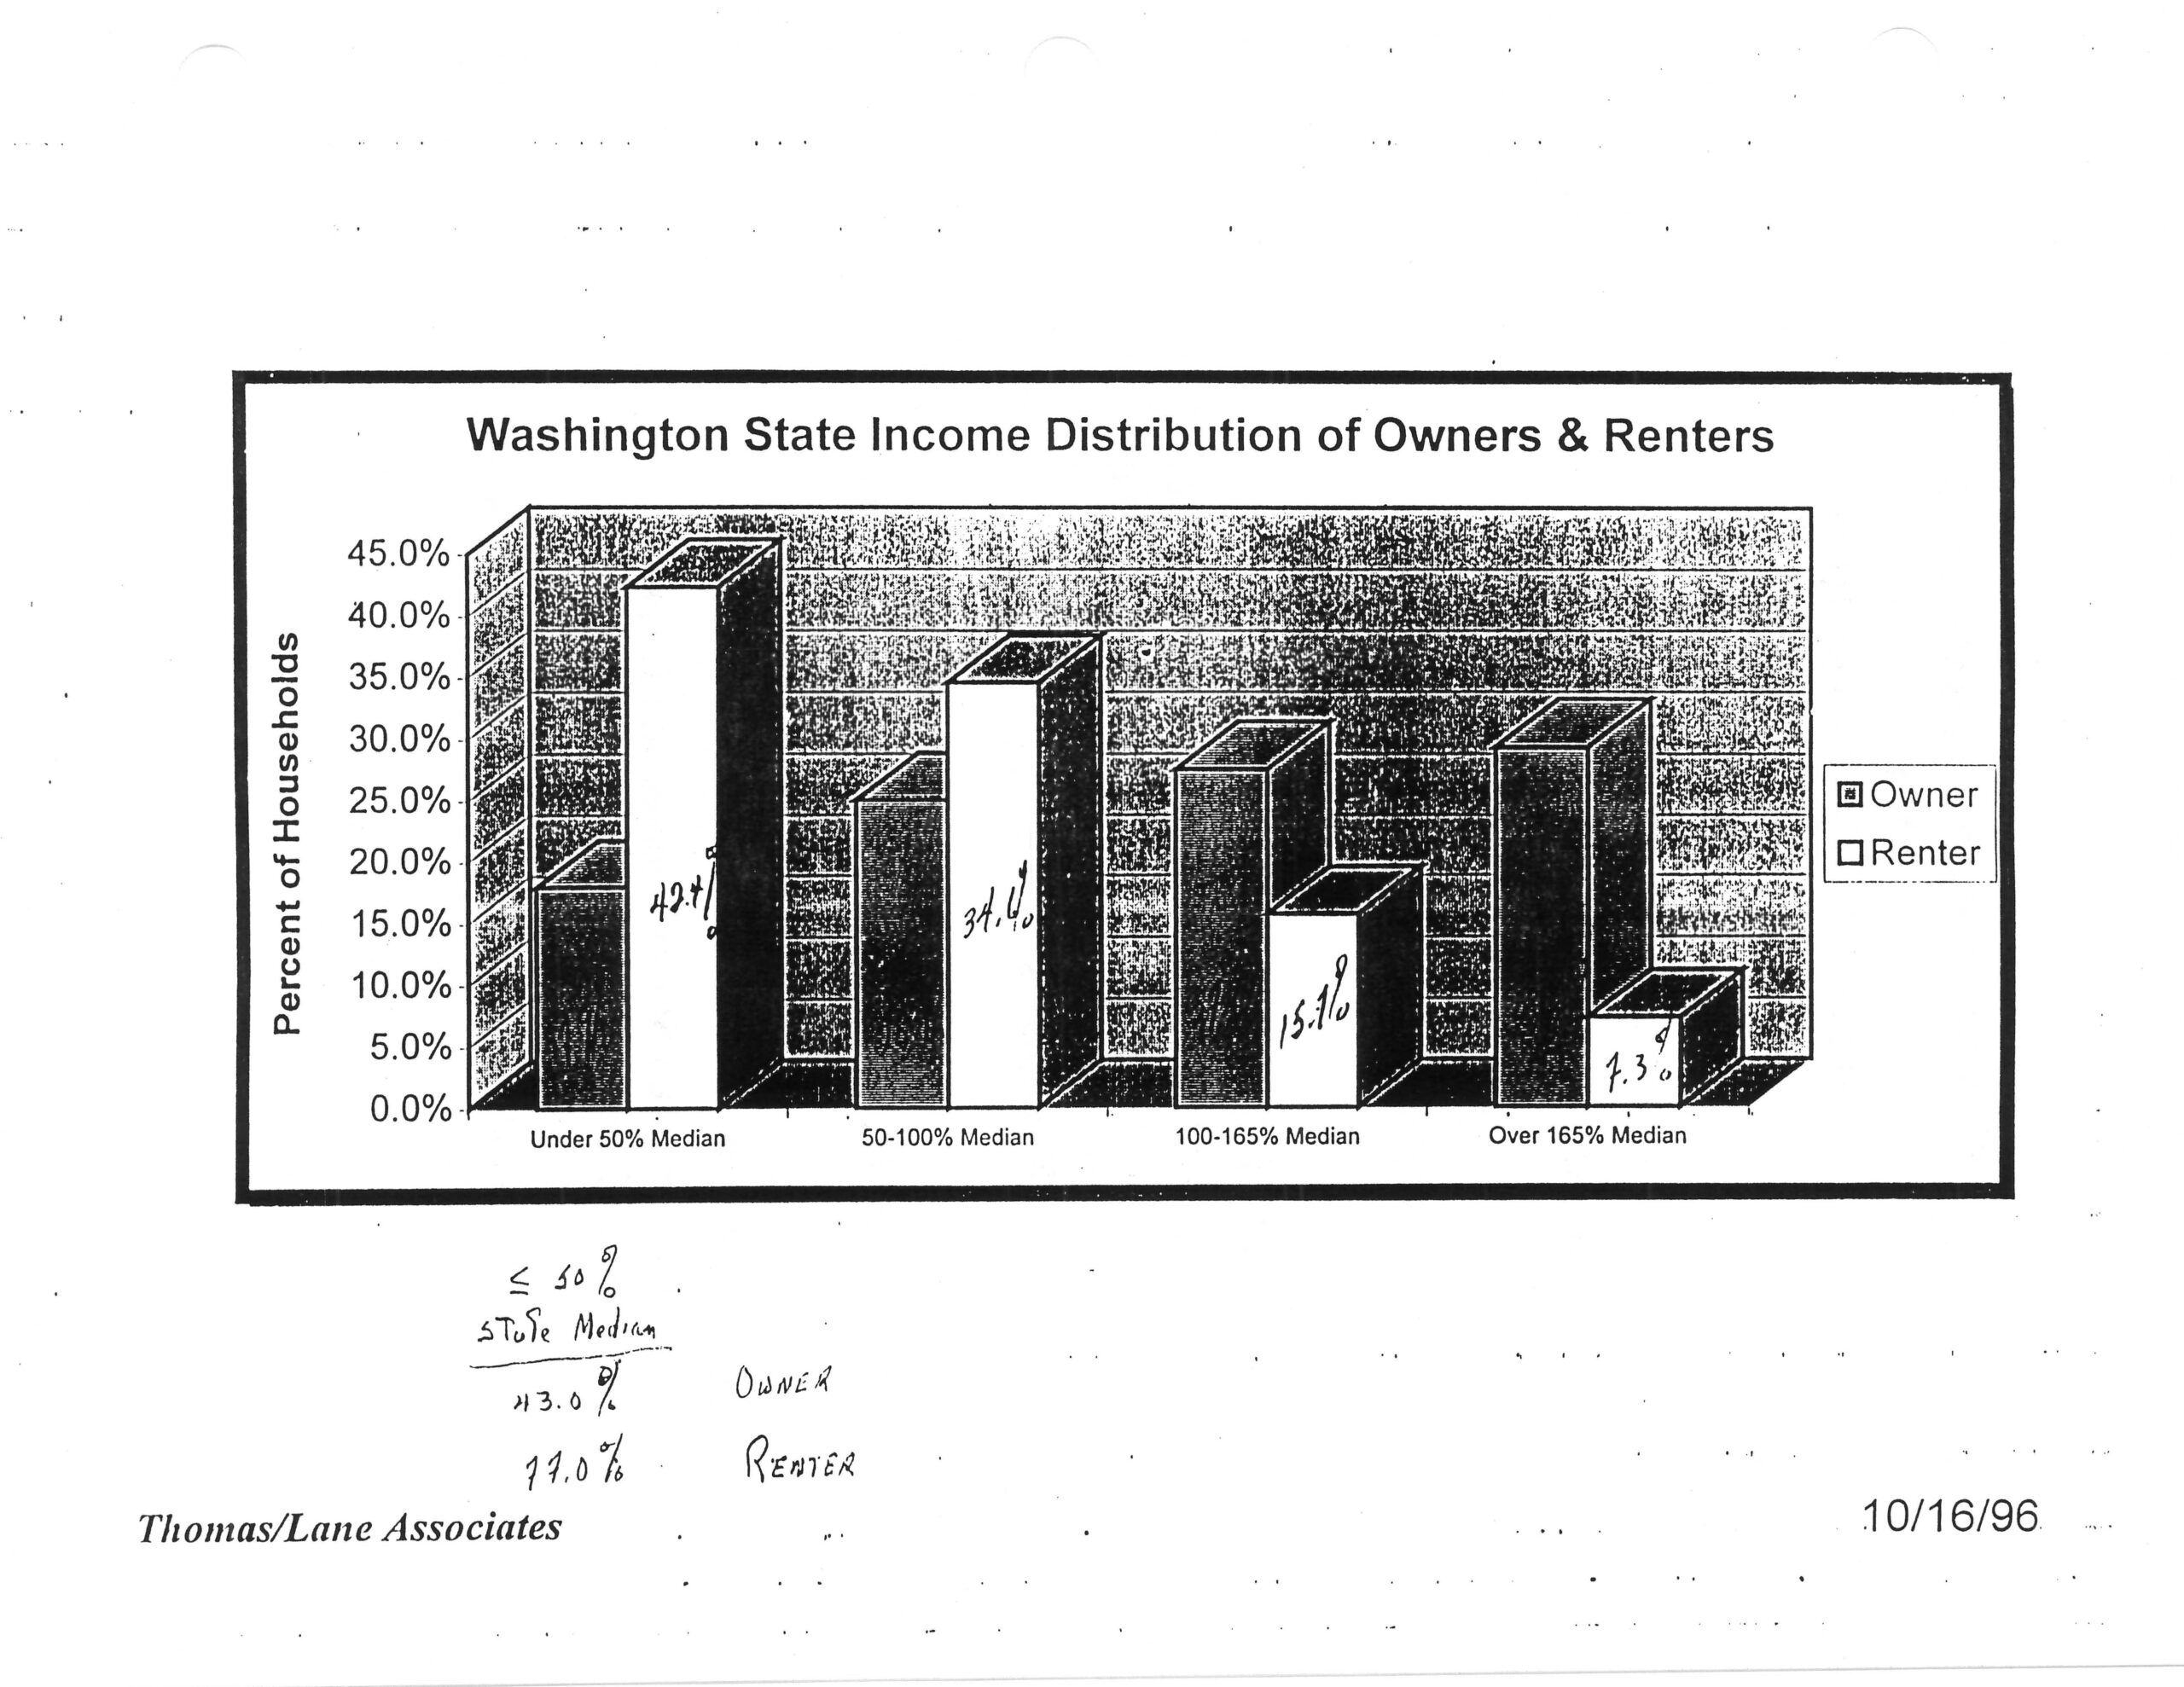
A bar chart prepared by Thomas/Lane Associates dated 10/16/96 showing Washington State income distribution of homeowners and renters across four median income brackets (Under 50%, 50-100%, 100-165%, and Over 165% Median). Handwritten annotations below the chart note that for households at or below 50% of state median income, owners represent 43.0% and renters 11.0%.Open full document
Notes
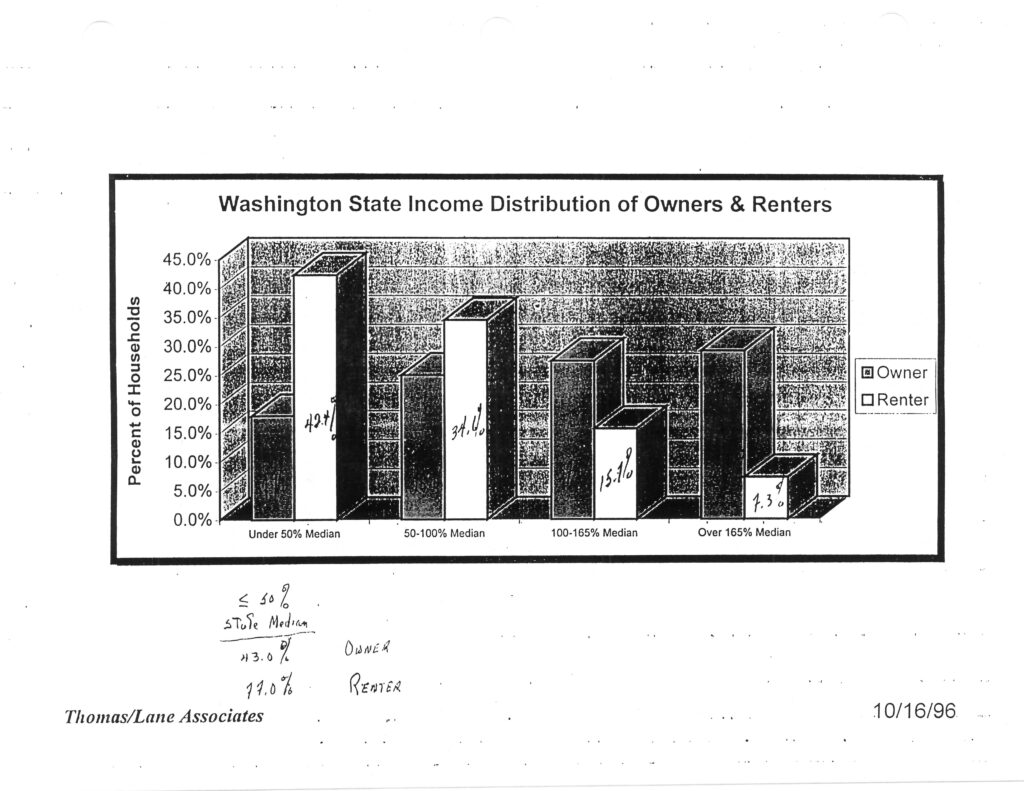
A bar chart prepared by Thomas/Lane Associates dated 10/16/96 showing Washington State income distribution of homeowners and renters across four median income brackets (Under 50%, 50-100%, 100-165%, and Over 165% Median). Handwritten annotations below the chart note that for households at or below 50% of state median income, owners represent 43.0% and renters 11.0%.