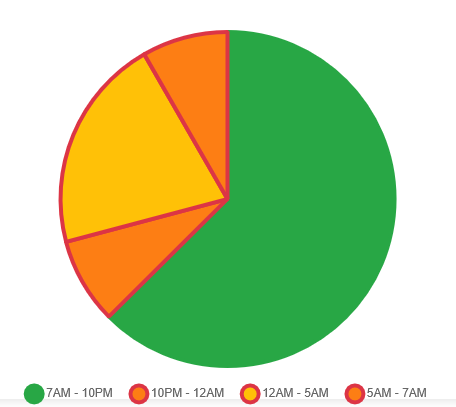
A pie chart breaking down flight activity into four time periods: 7AM–10PM (large green majority slice), 12AM–5AM (yellow), 10PM–12AM (orange), and 5AM–7AM (small orange). The chart appears to illustrate the distribution of aircraft operations or noise events across daily time windows relevant to Sea-Tac Airport noise policy analysis.Open full document
Notes
A pie chart breaking down flight activity into four time periods: 7AM–10PM (large green majority slice), 12AM–5AM (yellow), 10PM–12AM (orange), and 5AM–7AM (small orange). The chart appears to illustrate the distribution of aircraft operations or noise events across daily time windows relevant to Sea-Tac Airport noise policy analysis.