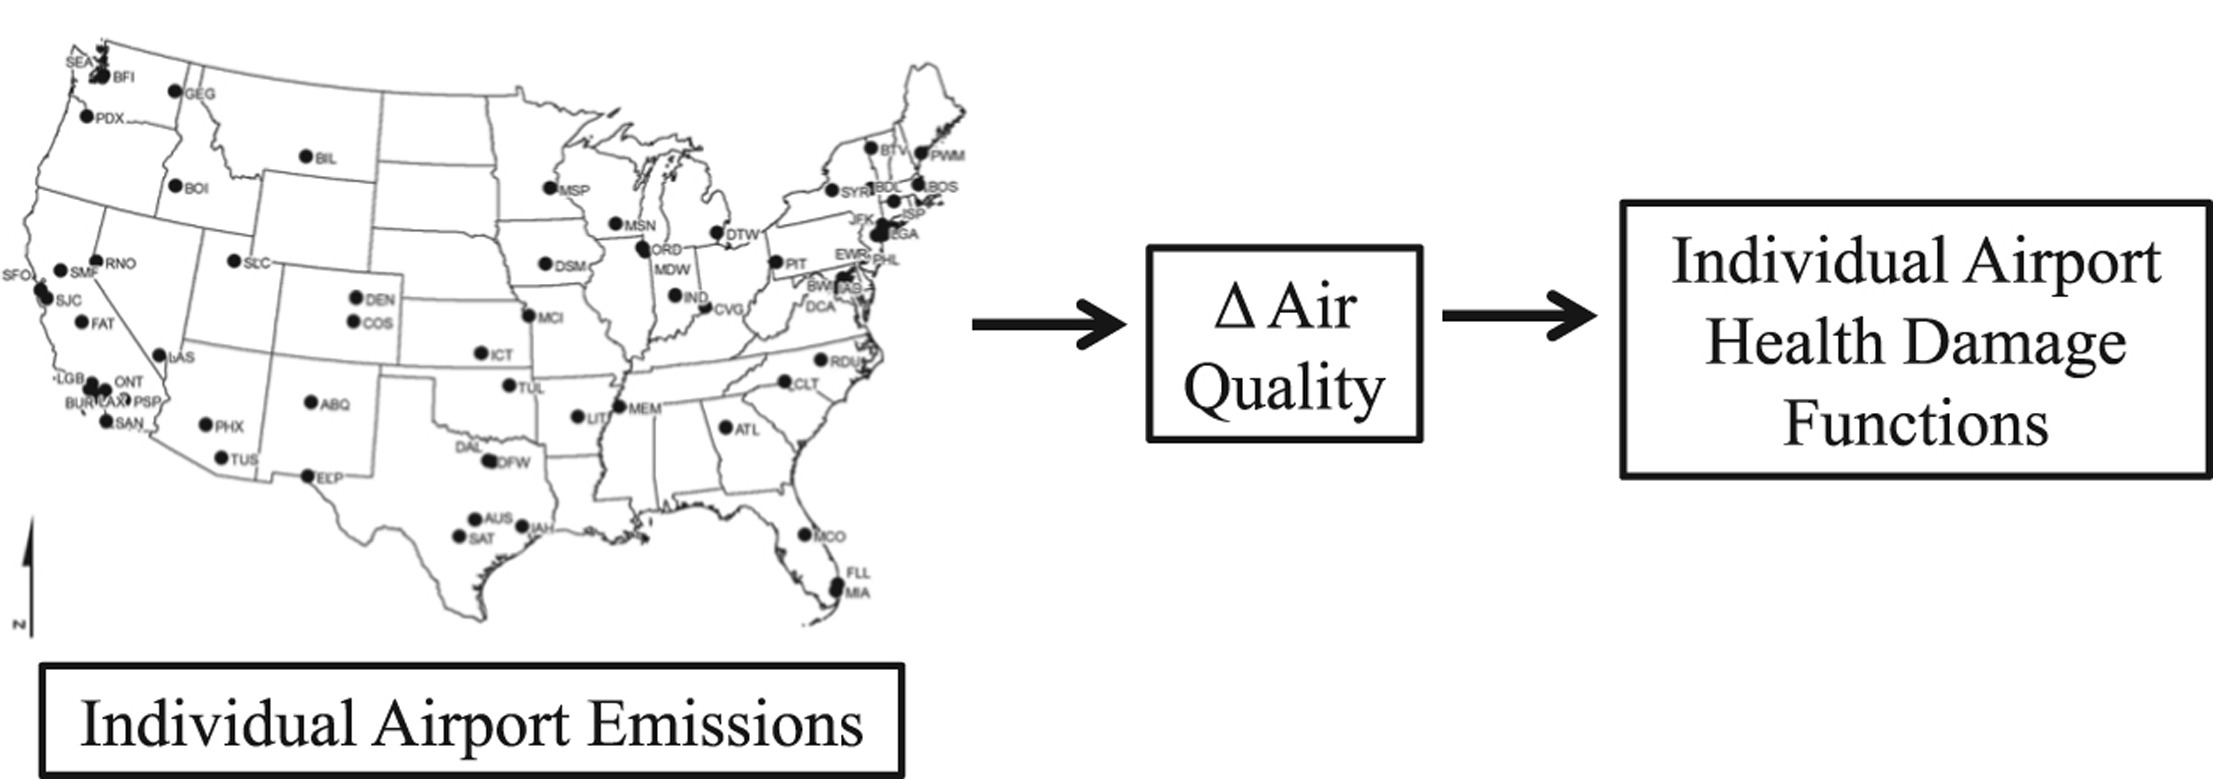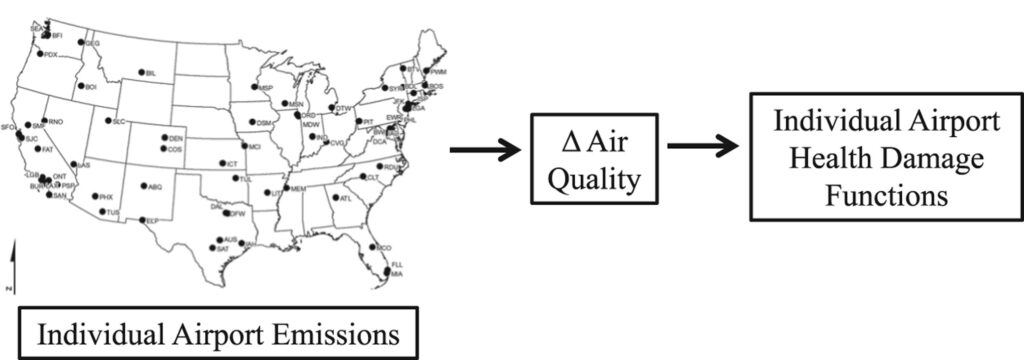
A research methodology diagram showing how individual airport emissions across approximately 70 U.S. airports (including SEA/Sea-Tac, labeled on the map) feed into air quality modeling (ΔAir Quality) and then into individual airport health damage functions. The map identifies Sea-Tac Airport (SEA) and Boeing Field (BFI) in the Seattle area among the airports studied.Open full document
Notes
A research methodology diagram showing how individual airport emissions across approximately 70 U.S. airports (including SEA/Sea-Tac, labeled on the map) feed into air quality modeling (ΔAir Quality) and then into individual airport health damage functions. The map identifies Sea-Tac Airport (SEA) and Boeing Field (BFI) in the Seattle area among the airports studied.