Notes
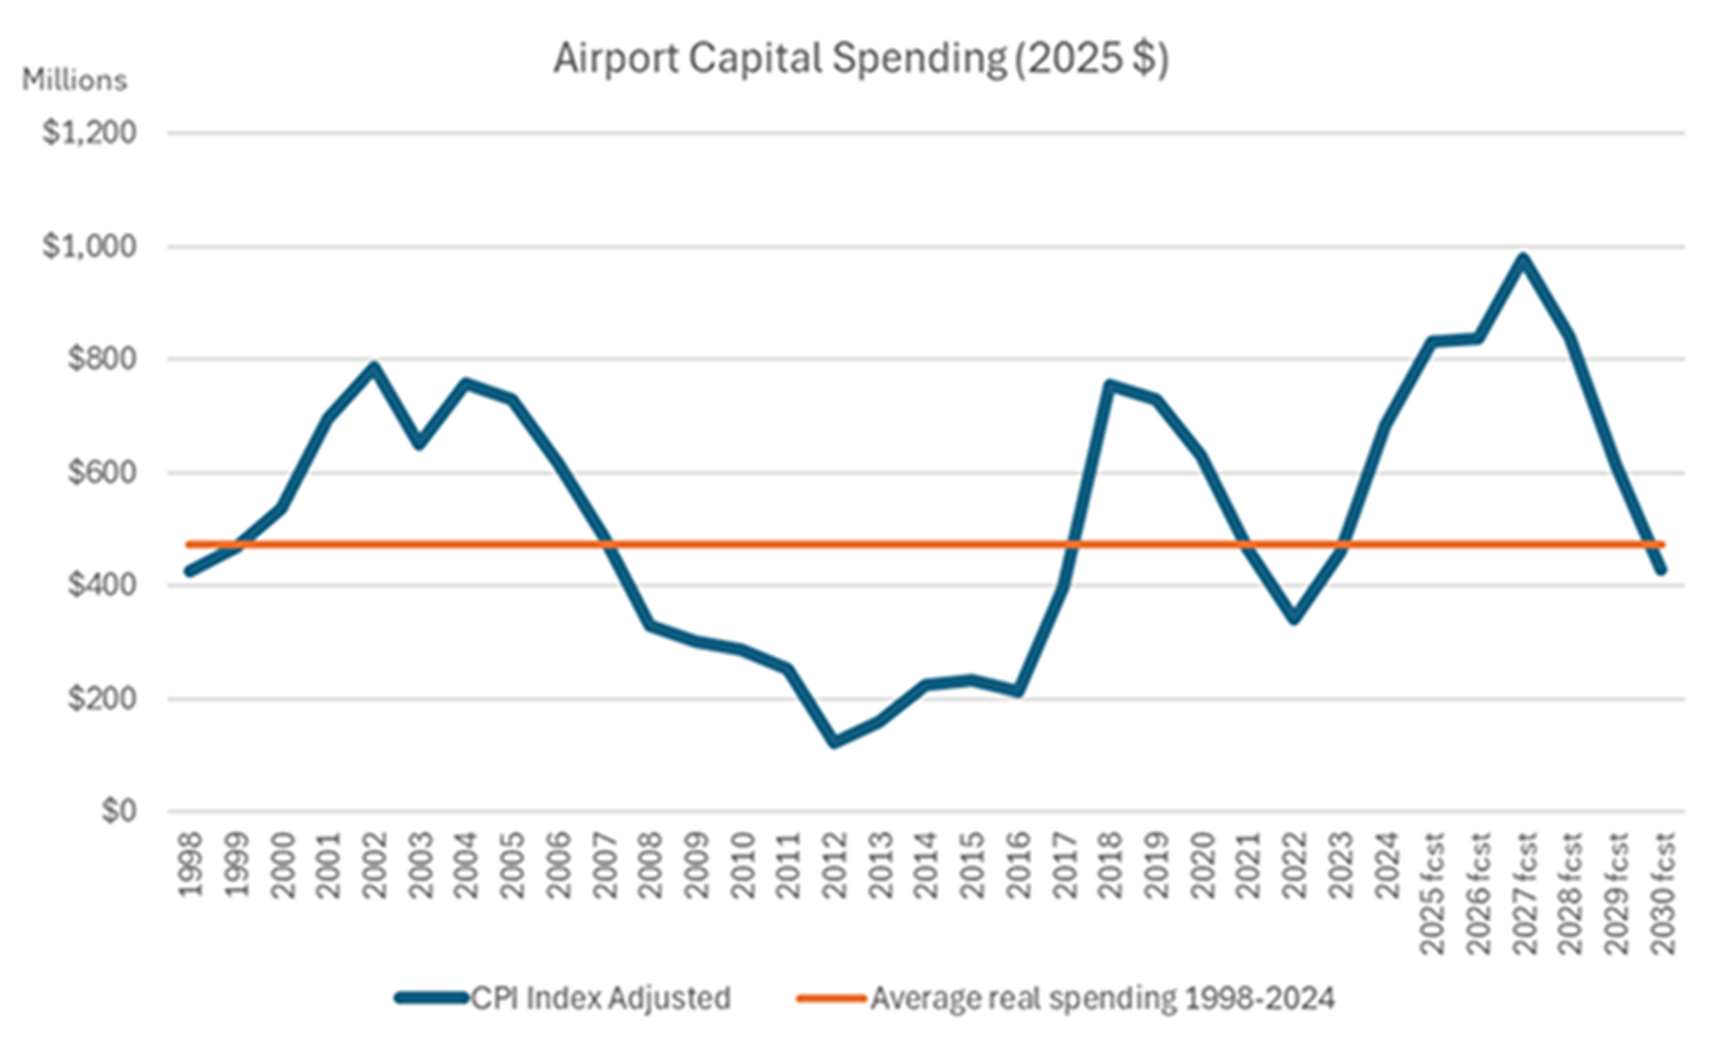
Chart showing airport capital spending from 1998 to 2030 in 2025 dollars, displaying CPI index adjusted spending compared to average real spending 1998-2024. The chart shows significant fluctuations with peaks around 2002, 2018, and projected 2025, and notable lows around 2013.