Notes
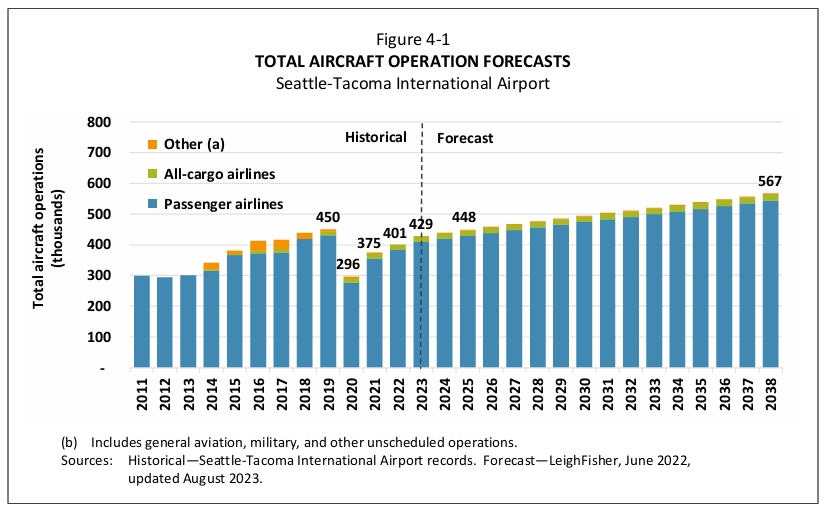
A bar chart showing historical and forecasted aircraft operations at Seattle-Tacoma International Airport from 2011 to 2038. The chart displays data for passenger airlines, all-cargo airlines, and other operations, with total operations growing from approximately 296,000 in 2011 to a projected 567,000 by 2038.