Notes
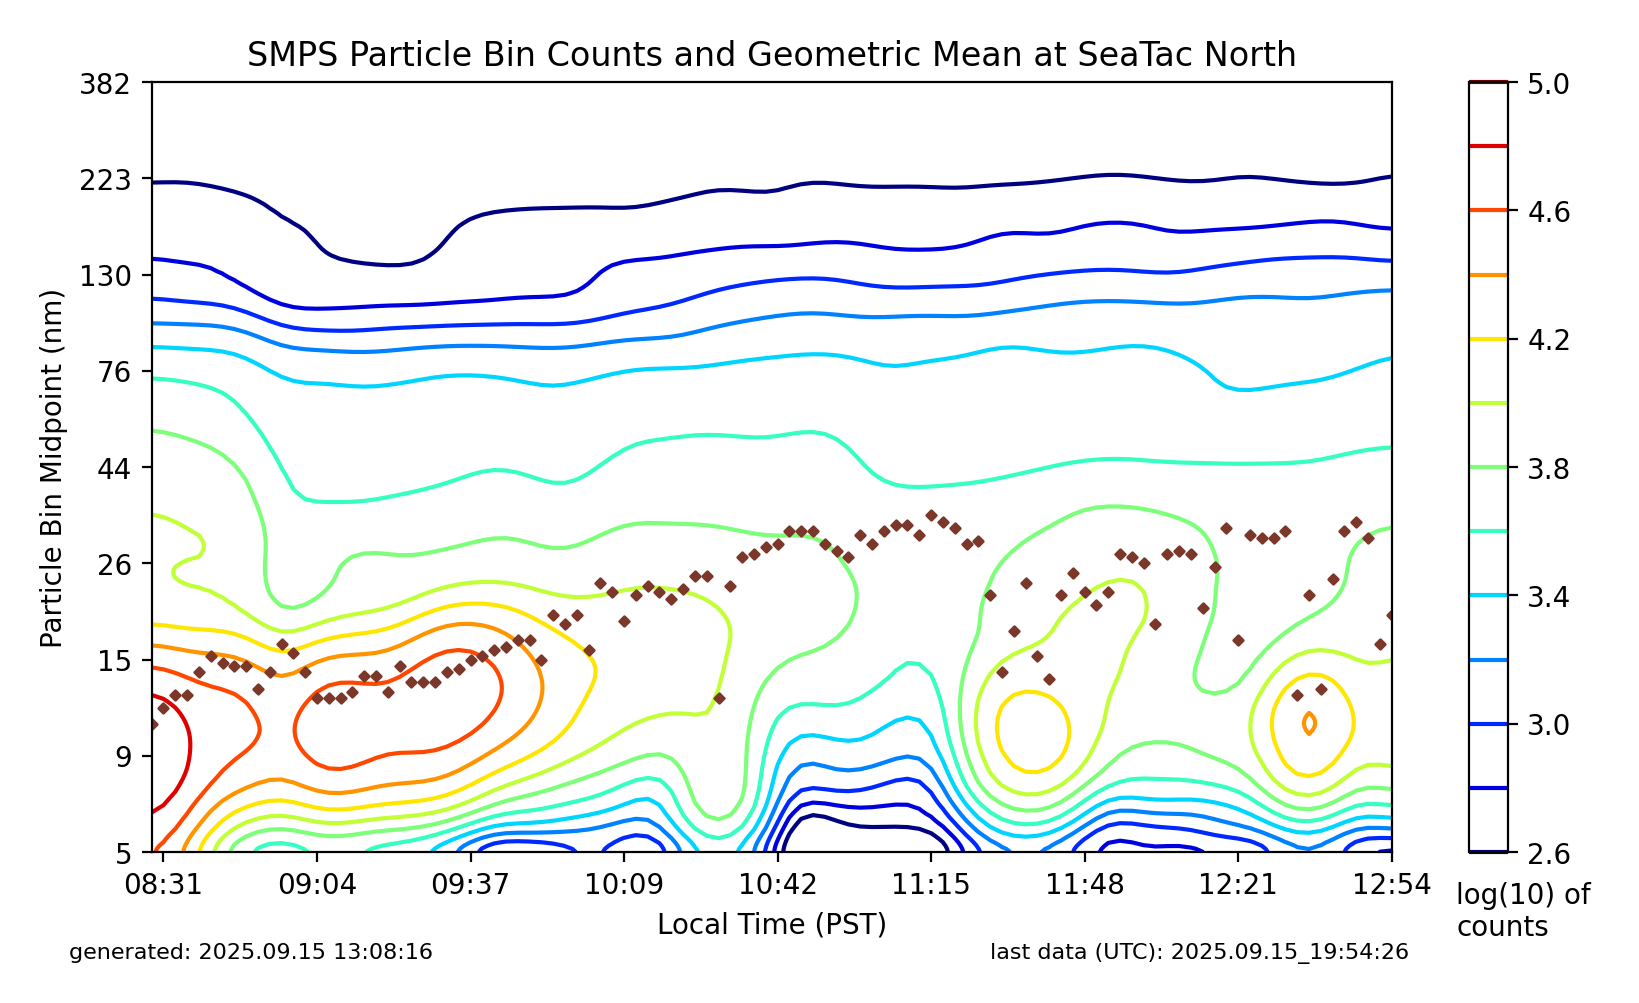
Scientific data chart showing particle size distribution measurements over time at SeaTac North location. The chart displays particle bin midpoints from 5-382 nm and geometric mean values using contour lines and color coding, with data points marked throughout the time period from 08:31 to 12:54 PST.