Notes
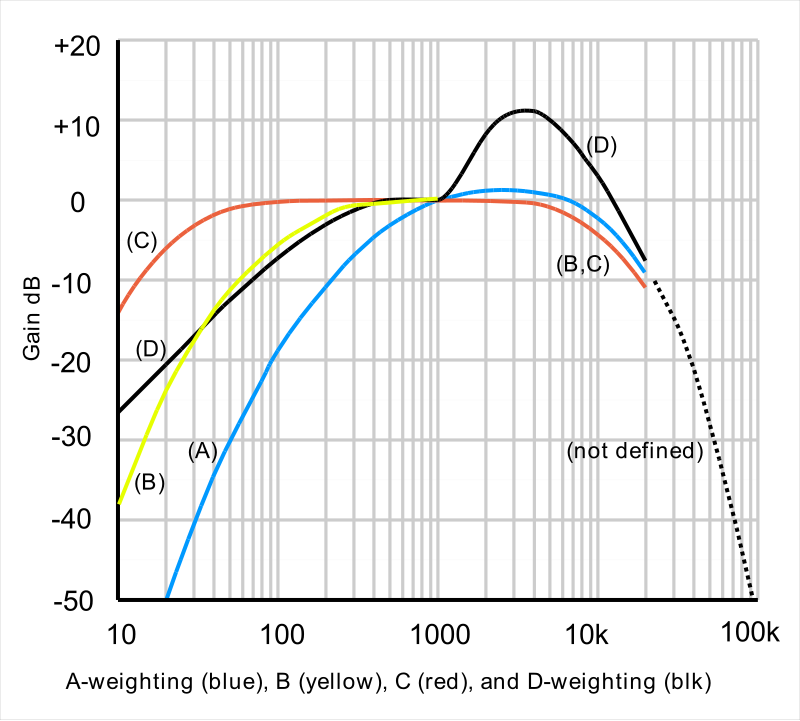
Technical chart showing frequency response curves for different audio weighting standards (A-weighting, B-weighting, C-weighting, and D-weighting) used in noise measurement and analysis. The graph displays gain in decibels across frequencies from 10 Hz to 100 kHz, with different colored lines representing each weighting standard.