Notes
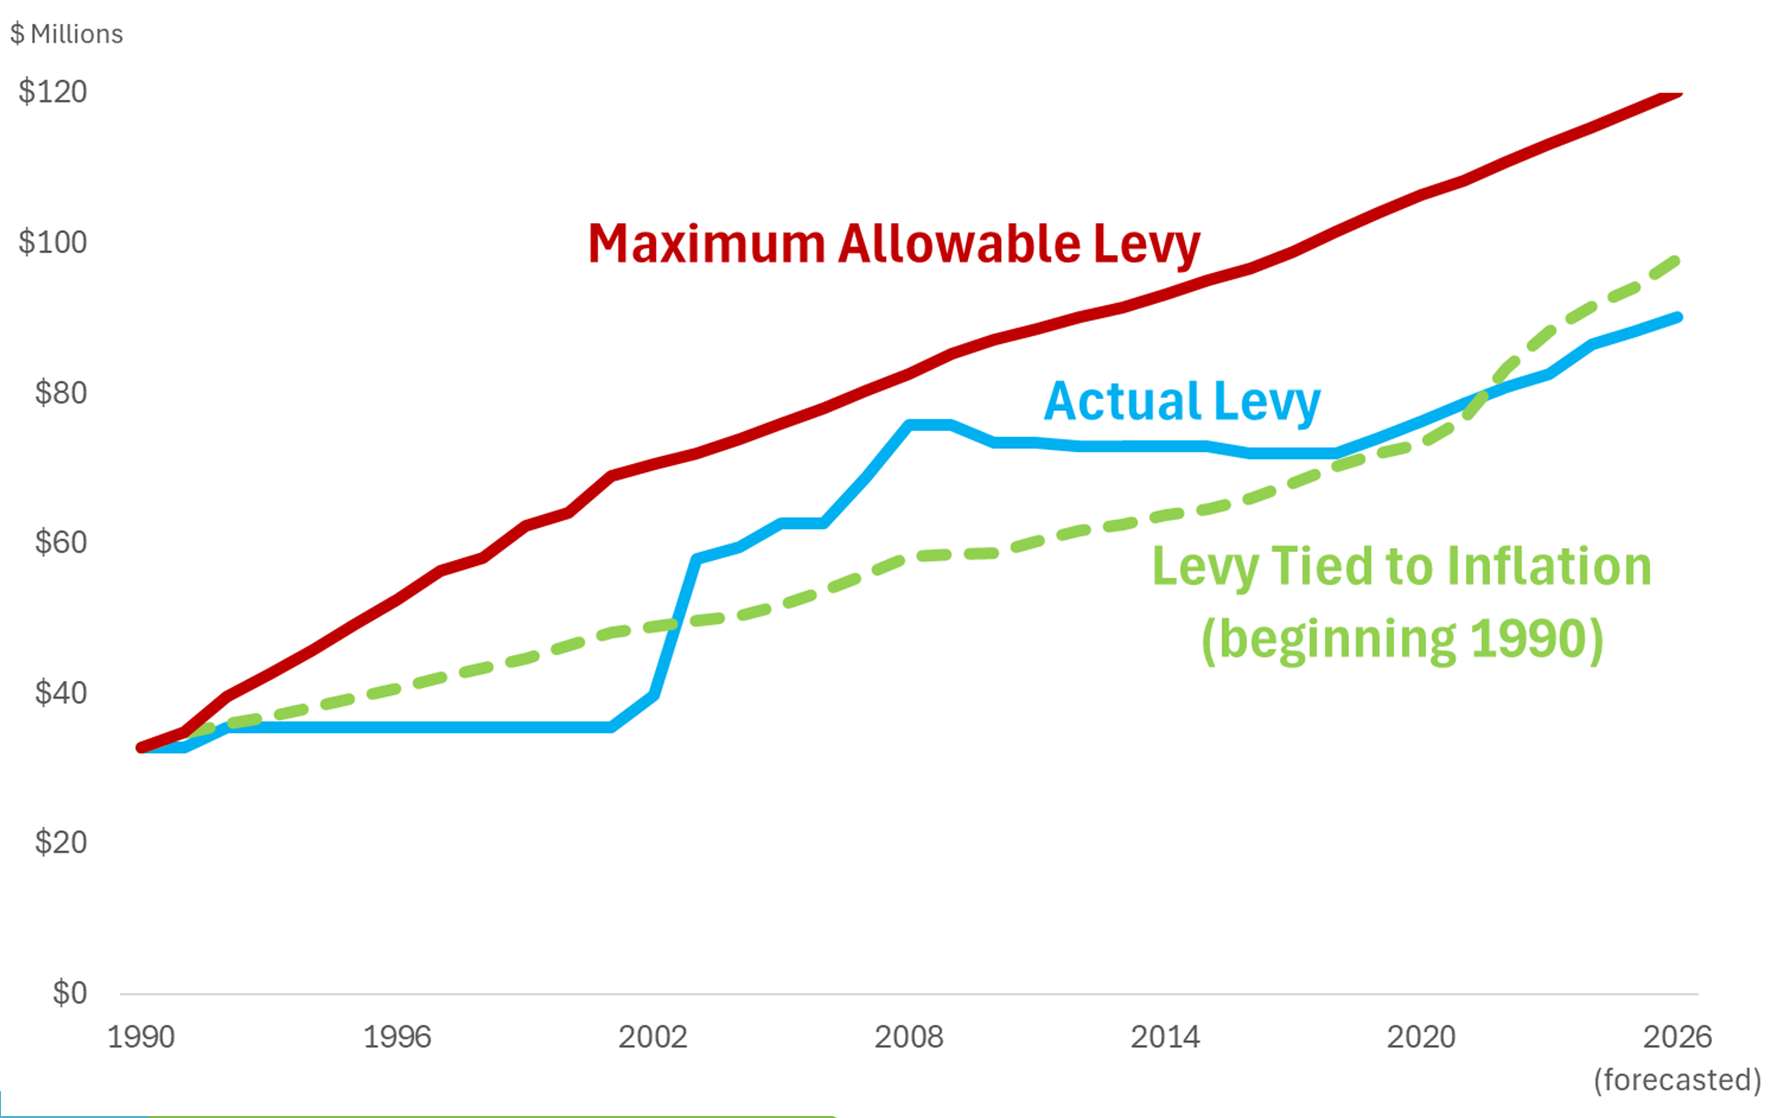
Chart comparing three levy scenarios from 1990 to 2026: Maximum Allowable Levy (red line showing steady growth to $120M), Actual Levy (blue line showing periods of flat growth), and a hypothetical Levy Tied to Inflation beginning in 1990 (green dashed line). Shows actual levy catching up to other scenarios around 2020.