Operations
| Year | Air Carrier | % of Total | Air Taxi | General Aviation | Military | Total | % Δ | |
|---|---|---|---|---|---|---|---|---|
| 1963 | 83989 | |||||||
| 1964 | 89373 | |||||||
| 1965 | 98690 | 10.4% | ||||||
| 1966 | 117074 | 18.6% | ||||||
| 1967 | 144026 | 23.0% | ||||||
| 1968 | 155558 | 8.0% | ||||||
| 1969 | 165820 | 6.6% | ||||||
| 1970 | 150676 | -9.1% | ||||||
| 1971 | 155144 | 3.0% | ||||||
| 1972 | 152344 | -1.8% | ||||||
| 1973 | 115445 | 73.00592546686 | 17866 | 22878 | 1,942 | 158131 | 3.8% | |
| 1974 | 106466 | 66.162469860051 | 31654 | 21492 | 1,304 | 160916 | 1.8% | |
| 1975 | 109962 | 67.148675797971 | 30896 | 21888 | 1,013 | 163759 | 1.8% | |
| 1976 | 114998 | 66.271718772511 | 31818 | 25865 | 844 | 173525 | 6.0% | |
| 1977 | 119166 | 62.710365949923 | 39143 | 30835 | 882 | 190026 | 9.5% | |
| 1978 | 119870 | 61.468327427684 | 41747 | 32787 | 607 | 195011 | 2.6% | |
| 1979 | 131647 | 62.114635136028 | 45739 | 33988 | 568 | 211942 | 8.7% | |
| 1980 | 143646 | 67.520588124694 | 40681 | 27876 | 541 | 212744 | 0.4% | |
| 1981 | 141015 | 67.813604558898 | 39400 | 27053 | 477 | 207945 | -2.3% | |
| 1982 | 138415 | 65.477260470969 | 49040 | 23583 | 356 | 211394 | 1.7% | |
| 1983 | 137920 | 65.910644052893 | 48757 | 22247 | 329 | 209253 | -1.0 | |
| 1984 | 142717 | 63.761906463892 | 59824 | 20878 | 409 | 223828 | 7.0% | |
| 1985 | 158904 | 67.698809655678 | 56954 | 18537 | 327 | 234722 | 4.9% | |
| 1986 | 187870 | 72.484904604819 | 54977 | 16052 | 286 | 259185 | 10.4% | |
| 1987 | 178682 | 61.376595540045 | 95337 | 16750 | 355 | 291124 | 12.3% | |
| 1988 | 176732 | 56.043304402424 | 124245 | 13925 | 447 | 315349 | 8.3% | |
| 1989 | 182460 | 54.605853833722 | 139215 | 12081 | 384 | 334140 | 6.0% | |
| 1990 | 193482 | 54.545147003685 | 150376 | 10556 | 305 | 354719 | 6.2% | |
| 1991 | 186717 | 55.17201641713 | 142828 | 8593 | 289 | 338427 | -4.6% | |
| 1992 | 196141 | 56.705522501113 | 140744 | 8699 | 310 | 345894 | 2.2% | |
| 1993 | 200040 | 58.958239387428 | 131046 | 7929 | 276 | 339291 | -1.9% | |
| 1994 | 212016 | 60.077357929188 | 132160 | 8358 | 371 | 352905 | 4.0% | |
| 1995 | 226190 | 58.530968184347 | 149444 | 10244 | 567 | 386445 | 9.5% | |
| 1996 | 239063 | 60.505582003953 | 149882 | 6077 | 87 | 395109 | 2.2% | |
| 1997 | 235445 | 61.25334630664 | 143034 | 5820 | 80 | 384379 | ||
| 1998 | 221705 | 54.395856488467 | 180563 | 5183 | 126 | 407577 | ||
| 1999 | 233914 | 53.941233171758 | 194352 | 5321 | 59 | 433646 | ||
| 2000 | 236355 | 53.039466272909 | 203723 | 5448 | 95 | 445621 | ||
| 2001 | 227589 | 56.805650887943 | 168322 | 4668 | 66 | 400645 | ||
| 2002 | 220733 | 60.531511717829 | 139793 | 4073 | 59 | 364658 | ||
| 2003 | 210603 | 59.363249429208 | 140777 | 3336 | 54 | 354770 | ||
| 2004 | 250605 | 69.847653767685 | 105377 | 2685 | 121 | 358788 | ||
| 2005 | 254829 | 74.563292583728 | 83928 | 67 | 2,938 | 341762 | -4.80% | |
| 2006 | 253507 | 74.548165312976 | 82147 | 108 | 4,296 | 340058 | -0.50% | |
| 2007 | 276954 | 79.803253747342 | 64745 | 107 | 5,240 | 347046 | 2.10% | |
| 2008 | 306425 | 88.806742269894 | 34453 | 110 | 4,059 | 345047 | -0.60% | |
| 2009 | 297621 | 93.628902108704 | 17133 | 73 | 3,046 | 317873 | -7.90% | |
| 2010 | 292016 | 93.012352128019 | 18562 | 114 | 3,262 | 313954 | -1.20% | |
| 2011 | 295763 | 93.90881640403 | 15327 | 149 | 3,708 | 314947 | 0.30% | |
| 2012 | 291664 | 94.207631210897 | 14196 | 133 | 3,604 | 309597 | -1.70% | |
| 2013 | 299156 | 94.315638142919 | 14440 | 80 | 3,510 | 317186 | 2.50% | |
| 2014 | 325425 | 95.578862657793 | 10813 | 127 | 4,113 | 340478 | 7.30% | |
| 2015 | 368722 | 96.673903011998 | 8401 | 125 | 4,160 | 381408 | 12.00% | |
| 2016 | 399742 | 96.984739306597 | 9513 | 93 | 2,822 | 412170 | 8.10% | |
| 2017 | 405049 | 97.338533706299 | 8651 | 86 | 2,338 | 416124 | 1.00% | |
| 2018 | 427170 | 97.440412782197 | 8509 | 87 | 2,625 | 438391 | 5.40% | |
| 2019 | 443817 | 98.519380137496 | 4456 | 79 | 2,135 | 450487 | 2.80% | |
| 2020 | 290130 | 98.000999837864 | 3899 | 171 | 1,848 | 296048 | -34.30% | |
| 2021 | 368872 | 98.494566233211 | 4254 | 1328 | 56 | 374510 | 20.90% | |
| 2022 | 395997 | 98.6660055662 | 3926 | 1373 | 55 | 401351 | 7.2% | |
| 2023 | 417346 | 98.778247985837 | 2781 | 1308 | 59 | 422508 | 5.27% | |
| 2024 | 428915 | 98.778247985837 | 4078 | 1280 | 48 | 434321 | 2.80% | |
| 12106718 | 3629848 | 491423 | 9847 | 17186999 |
Air carrier: Scheduled aircraft operation with over 70 seats
Air Taxi: Scheduled aircraft operation with less than 70 seats
Source: Federal Aviation Administration (FAA)
Passengers
| Domestic | International | Total Pax | % Δ | |||||
|---|---|---|---|---|---|---|---|---|
| Deplaned | Enplaned | Total Pax | Deplaned | Enplaned | Total Pax | |||
| 1961 | 1426508 | 192759 | 1619267 | |||||
| 1962 | 1797464 | 202835 | 2000299 | 23.50% | ||||
| 1963 | 1604195 | 176338 | 1780533 | -11.00% | ||||
| 1964 | 1789234 | 211697 | 2000931 | 12.40% | ||||
| 1965 | 2085836 | 251865 | 2337701 | 16.80% | ||||
| 1966 | 2539582 | 282425 | 2822007 | 20.70% | ||||
| 1967 | 3514830 | 338777 | 3853607 | 36.60% | ||||
| 1968 | 4070198 | 364580 | 4434778 | 15.10% | ||||
| 1969 | 4423000 | 381928 | 4804928 | 8.30% | ||||
| 1970 | 4270257 | 383186 | 4653443 | -3.20% | ||||
| 1971 | 4319336 | 378269 | 4697605 | 0.90% | ||||
| 1972 | 4381861 | 407101 | 4788962 | 1.90% | ||||
| 1973 | 4644053 | 561040 | 5205093 | 8.70% | ||||
| 1974 | 5137734 | 634482 | 5772216 | 10.90% | ||||
| 1975 | 5497178 | 615245 | 6112423 | 5.90% | ||||
| 1976 | 6158045 | 648703 | 6806748 | 11.40% | ||||
| 1977 | 6646413 | 686030 | 7332443 | 7.70% | ||||
| 1978 | 7665983 | 701994 | 8367977 | 14.10% | ||||
| 1979 | 9017605 | 802814 | 9820419 | 17.40% | ||||
| 1980 | 8247226 | 947424 | 9194650 | -6.40% | ||||
| 1981 | 8150623 | 967007 | 9117630 | -0.80% | ||||
| 1982 | 8518366 | 760371 | 9278737 | 1.80% | ||||
| 1983 | 9256036 | 885701 | 10141737 | 9.30% | ||||
| 1984 | 9468444 | 1008186 | 10476630 | 3.30% | ||||
| 1985 | 10436161 | 1030594 | 11466755 | 9.50% | ||||
| 1986 | 12465343 | 1177323 | 13642666 | 19.00% | ||||
| 1987 | 13180582 | 1264900 | 14445482 | 5.90% | ||||
| 1988 | 13095487 | 1400032 | 14495519 | 0.30% | ||||
| 1989 | 13710455 | 1530803 | 15241258 | 5.10% | ||||
| 1990 | 14399529 | 1840780 | 16240309 | 6.60% | ||||
| 1991 | 14759181 | 1554108 | 16313289 | 0.40% | ||||
| 1992 | 16462515 | 1499702 | 17962217 | 10.10% | ||||
| 1993 | 17393527 | 1406997 | 18800524 | 4.70% | ||||
| 1994 | 19482971 | 1489848 | 20972819 | 11.60% | ||||
| 1995 | 21107946 | 1666040 | 22773986 | 8.60% | ||||
| 1996 | 22511310 | 1813286 | 24324596 | 8.50% | ||||
| 1997 | 22887340 | 1842773 | 24730113 | 1.67% | ||||
| 1998 | 23710257 | 2153209 | 25863466 | 4.50% | ||||
| 1999 | 25270402 | 2435086 | 27705488 | 7.10% | ||||
| 2000 | 25962051 | 2446502 | 28408553 | 2.50% | ||||
| 2001 | 24683837 | 2352236 | 27036073 | -4.80% | ||||
| 2002 | 24440713 | 2297845 | 26738558 | -1.10% | ||||
| 2003 | 24527470 | 2272443 | 26799913 | 0.20% | ||||
| 2004 | 26368448 | 2436106 | 28804554 | 7.50% | ||||
| 2005 | 13410018 | 13407973 | 26817991 | 1246871 | 1224164 | 2471035 | 29289026 | 1.70% |
| 2006 | 13753511 | 13764088 | 27517599 | 1252266 | 1226559 | 2478825 | 29996424 | 2.40% |
| 2007 | 14272440 | 14313379 | 28585819 | 1362147 | 1347856 | 2710003 | 31295822 | 4.30% |
| 2008 | 14626611 | 14647483 | 29274094 | 1484978 | 1437456 | 2922434 | 32196528 | 2.90% |
| 2009 | 14297596 | 14296186 | 28593782 | 1319718 | 1314012 | 2633730 | 31227512 | -3.00% |
| 2010 | 14381433 | 14363581 | 28745014 | 1398385 | 1409767 | 2808152 | 31553166 | 1.00% |
| 2011 | 14924361 | 14913831 | 29838192 | 1501371 | 1483657 | 2985028 | 32823220 | 4.00% |
| 2012 | 14992096 | 14982946 | 29975042 | 1633691 | 1614378 | 3248069 | 33223111 | 1.20% |
| 2013 | 15643247 | 15604129 | 31247376 | 1807178 | 1772187 | 3579365 | 34826741 | 4.80% |
| 2014 | 16851340 | 16824379 | 33675719 | 1930149 | 1892399 | 3822548 | 37498267 | 7.70% |
| 2015 | 19016085 | 18944106 | 37960191 | 2215696 | 2164650 | 4380346 | 42340537 | 12.90% |
| 2016 | 20485624 | 20385030 | 40870654 | 2455373 | 2411088 | 4866461 | 45737115 | 8.00% |
| 2017 | 20942362 | 20861988 | 41804350 | 2576675 | 2553594 | 5130269 | 46934619 | 2.60% |
| 2018 | 22221601 | 22200368 | 44421969 | 2733581 | 2693970 | 5427551 | 49849520 | 6.20% |
| 2019 | 23085429 | 23015911 | 46101340 | 2869935 | 2857964 | 5727899 | 51829239 | 4.00% |
| 2020 | 9315619 | 9372941 | 18688560 | 693023 | 663765 | 1356788 | 20045348 | -61.30% |
| 2021 | 17233386 | 17251456 | 34484842 | 847703 | 821470 | 1669173 | 36154015 | 80.38% |
| 2022 | 20801479 | 20780867 | 41582346 | 2196569 | 2185252 | 4381821 | 45964321 | 27.13% |
| 2023 | 22587484 | 22502280 | 45089764 | 2918340 | 2869156 | 5787496 | 50877260 | 10.69% |
| 2024 | 23034552 | 23017584 | 46052136 | 3316918 | 3271662 | 6588580 | 52640716 | 3.46% |
| 345876274 | 345450506 | 1202812312 | 37760567 | 37215006 | 123676943 | 1326489409 |
*1996 total pax are correct. Domestic and International pax, derived estimates.
It’s complicated: a brief analysis
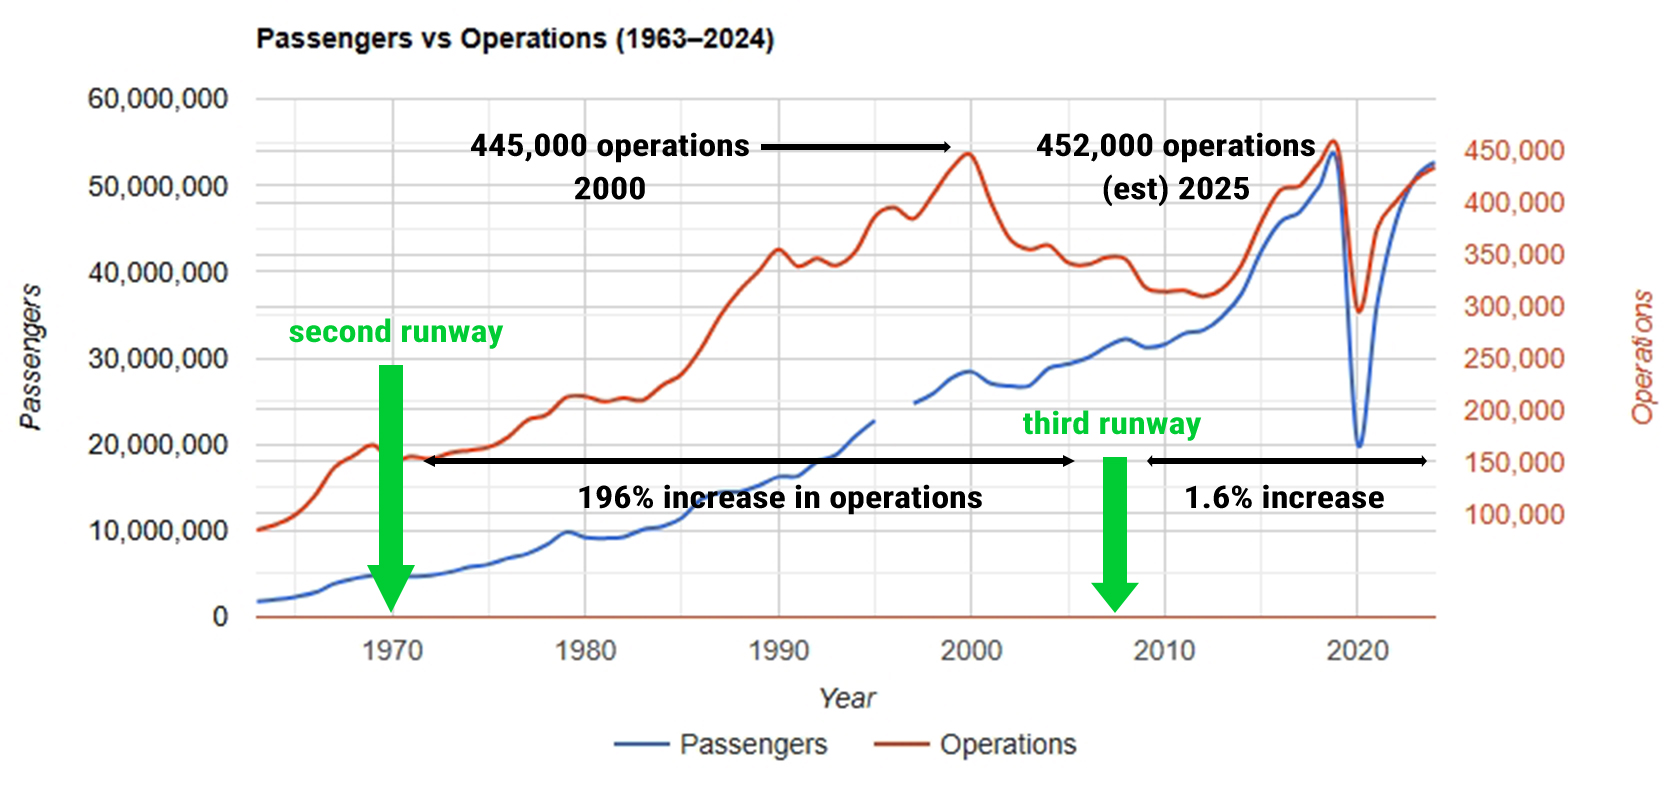
Nothing about airports is simple. The Port of Seattle usually focuses on passengers–each representing revenue. People living under the flight path care about operations–which means something quite different. But the relationship between the two is not what most people think.
A second runway was added in 1970. Thirty years later, in 2000, the number of annual operations had almost tripled. Adding a third has increased those numbers by less than two percent.
And yet, since 2000, the number of passengers has doubled. Part of the explanation has to do with fleet mix. Over time, Sea-Tac has shifted from a wide variety of aircraft almost exclusively to large commercial jets.
For air traffic control ‘a blip is just a blip’. Managing this increase feels closer to the two percent than the 100%. For residents, it is the opposite. Despite a relatively small increase in flights, and in spite of industry efforts to create ‘quieter’ aircraft, the change in lived experience is obvious.
Neither metric–passenger counts or annual operations–adequately captures the dramatic change in lived experience.